

Bright Line Watch June 2021 surveys
As the country turns 245 years old, Americans have reasons to worry about the state of their democracy. In June 2021, we surveyed a representative sample of Americans and an expert sample of political scientists on the performance of U.S. democracy, the threats it faces, and how their political representatives should address these matters.1 We find deep partisan polarization in perceptions of what is right and wrong with American democracy and the steps that should be taken to fix it. In addition, experts express reservations about current changes to election law at the state level. Still, we find some signs that Americans regard partisan attacks on election administration with skepticism.
Our key findings are:
• Constitutional hardball politics like gerrymandering, packing the Supreme Court or blocking Court nominees, voter suppression, abolishing the filibuster, adding new states to the union, or refusing to certify election results enjoy little support among the public and, with few exceptions, among experts. However, these strategies appear to go unpunished by voters when used by elites.
• Experts expect these tactics to be used more frequently in the years ahead, rating extreme partisan gerrymandering a near certainty; obstruction of Supreme Court nominations highly likely; and refusal to certify popular vote totals as a likely outcome as well. By contrast, the experts place low probability on hardball tactics that are more favored by Democrats, such as adding states to the union, abolishing the filibuster, or packing the Supreme Court.
• Among the electoral reform proposals recently adopted or currently under consideration in the states, experts perceive grave threats from bills that encroach on the political independence of local election officials and that restrict mail voting.
• Exposure to information about the official audit in Maricopa County, Arizona more than doubled confidence in the vote count in Republicans, suggesting that information about standard processes intended to verify the results of elections can be reassuring to skeptical members of the public. Surprisingly, exposure to news about the partisan “audit” there also increased confidence among Republicans somewhat, though this effect seems unlikely to persist when the supposed results of that process are announced.
• The legitimacy of the 2020 presidential election and Donald Trump’s actions afterward remain central to how Americans assess political candidates. In the past six months, Democrats and Republicans have not budged in how they reward or punish prospective candidates for voting to certify the election and for Trump’s impeachment. Independents did shift in favor of candidates who supported the certification of the 2020 vote and who supported transportation infrastructure spending.
• Distressingly high proportions of respondents say they would be willing to secede from the United States to join a new union of states in their region. Support is higher among Republicans in Republican-dominated regions and among Democrats in Democrat-dominated regions, but the idea’s popularity has risen in some partisan groups and regions of the country since Biden’s inauguration.
• Experts rate Donald Trump’s continued refusal to accept the results of the 2020 election as highly abnormal and important.
Constitutional hardball
The June 2021 survey asked both our public and expert samples about their support for a range of practices that have come to be known as “constitutional hardball.” The term describes strategies by which political actors seek to extend their political power and gain advantage by actions that are within the formal bounds of constitutional doctrine but that break with longstanding political practices. In October 2019, we reported on support for hardball politics. The current survey repeats some of those questions and adds new ones about tactics that have entered mainstream political discussion more recently. These scenarios fall into four broad categories: legislative process, impeachment, the courts, and elections and representation. The list below contains our 12 constitutional hardball statements by category.
Legislative process
• A majority party in either chamber of Congress refusing to raise the limit on the amount of money the U.S. government can legally borrow.
• The majority party in the Senate abolishing the filibuster rule so it can pass legislation without minority party support.
• The minority party in the Senate routinely using the filibuster rule to block legislation supported only by the majority party.
Impeachment
• A majority of the House of Representatives seeking to impeach a president because they believe he or she is unfit for office rather than because of specific evidence of high crimes and misdemeanors.
Courts
• The majority party in the Senate refusing to consider any nomination by a president to fill an open seat on the Supreme Court.
• A party that controls Congress and the presidency creating and filling new seats on the Supreme Court to change the partisan balance of power.
Elections and representation
• A party that controls both chambers of Congress granting statehood to Washington, D.C. and Puerto Rico.
• A state political party drawing Congressional districts that ensure it will receive a share of seats much larger than its share of votes.
• A state political party proposing measures that make it more difficult to vote, especially for members of the other party.
• Local election officials refusing to certify the vote totals recorded in their area.
• A state legislature naming electors to the Electoral College other than those designated by the popular vote in that state.
• Congress refusing to certify presidential election results that have been submitted by the states.
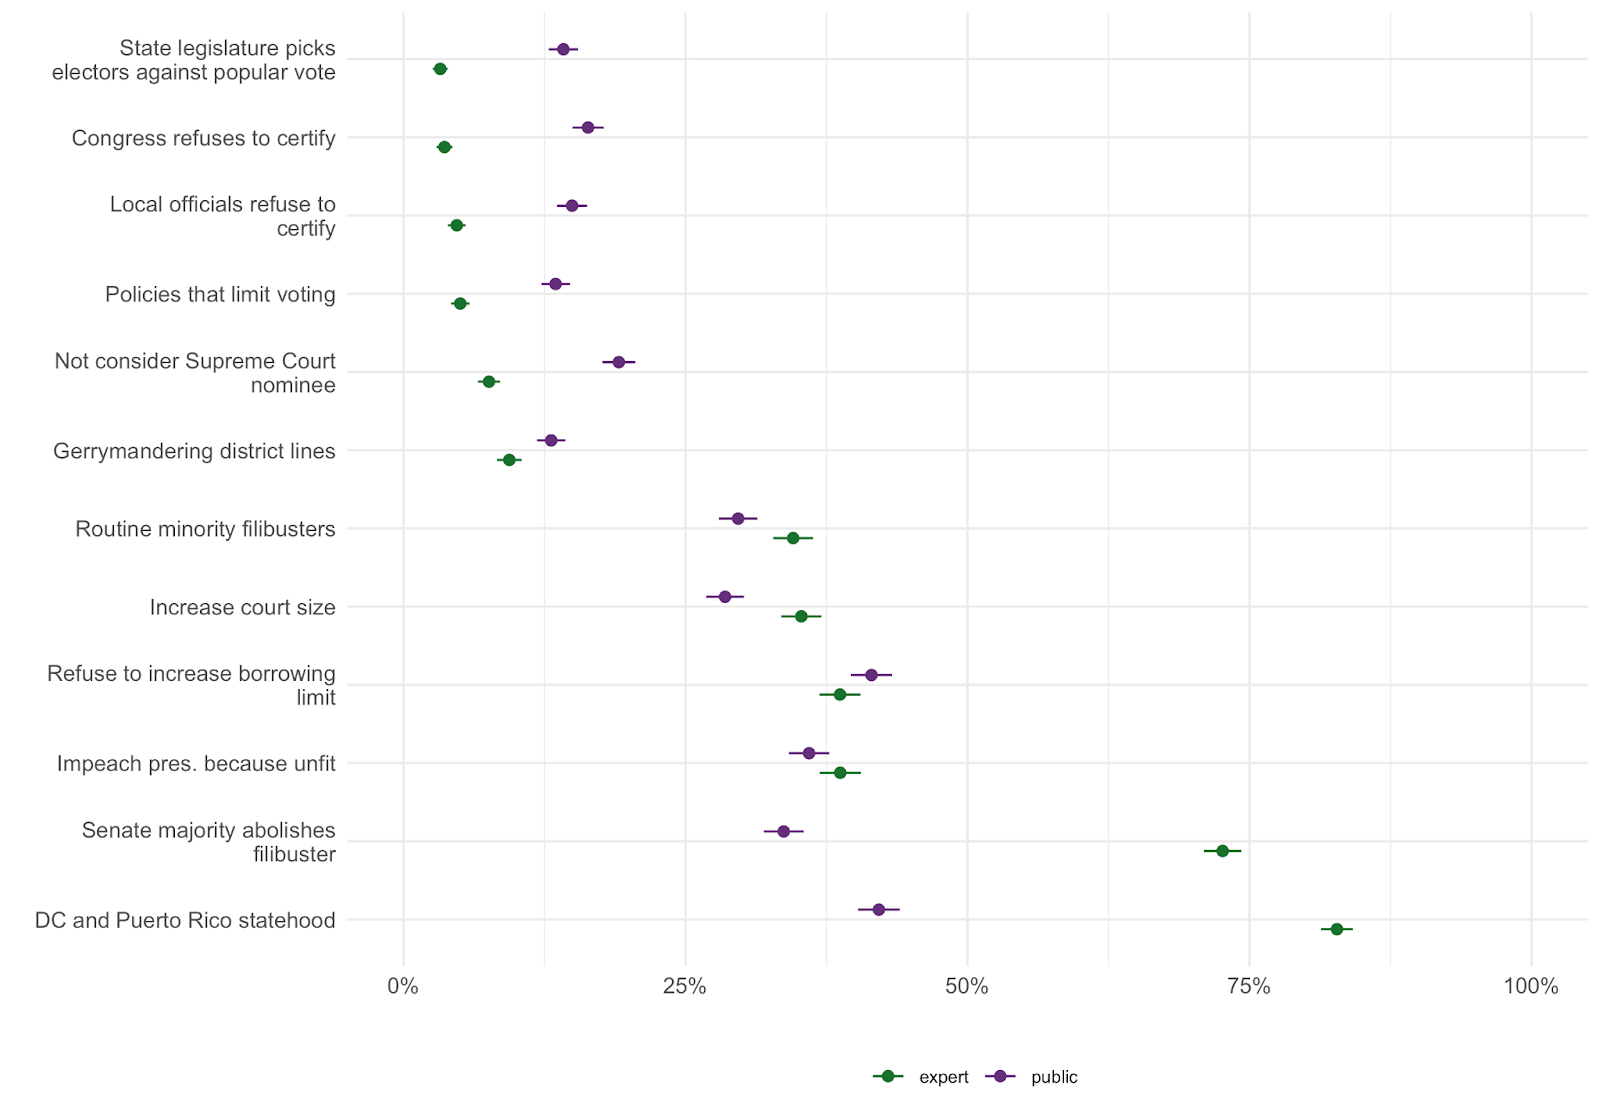
Each survey respondent was shown all twelve statements in random order and asked to indicate “how appropriate or inappropriate you consider each scenario to be” on a four-point scale from “Entirely appropriate” to “Entirely inappropriate” or to indicate that they are not sure. The figure below shows the percentage of respondents who rated each item on the list as mostly or entirely appropriate. Green markers show responses among our expert sample; blue and red markers show responses among Democrat and Republican members of the public, respectively (separate graphs showing total public support versus experts and disaggregating Democrats, Republicans, and independents in the public sample are provided in the Appendix). The items are ranked in ascending order of perceived appropriateness among the experts.
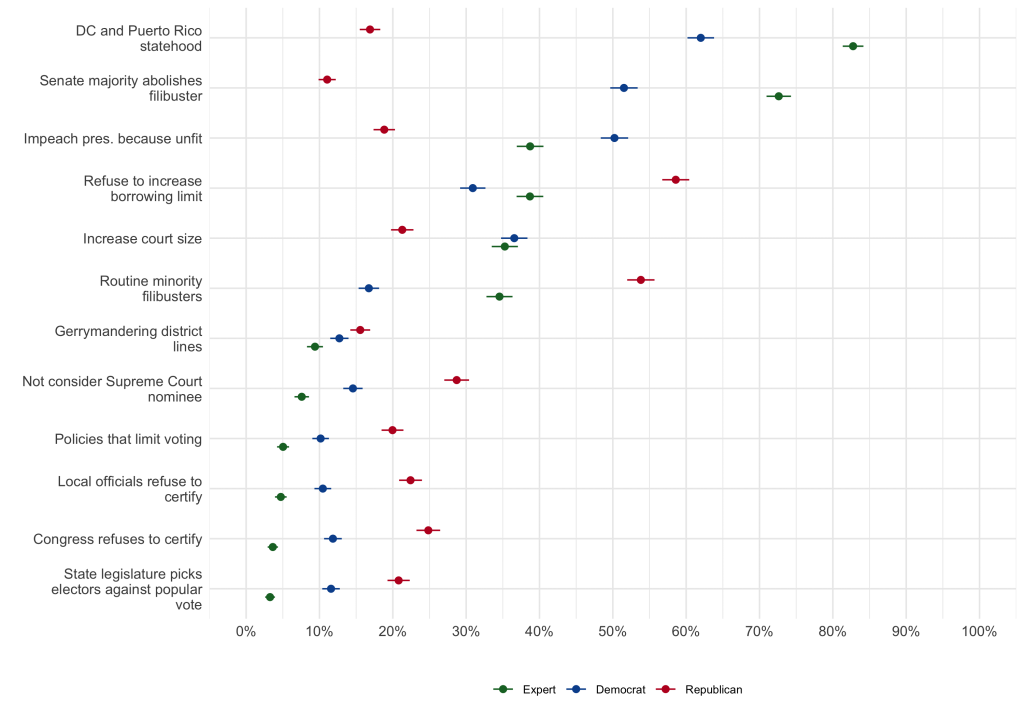
Several results are noteworthy. First, hardball tactics related to elections and representation are the most consistently and strenuously disapproved, particularly three scenarios that have attracted substantial attention since the 2020 election: 1) local officials refusing to certify recorded vote totals, 2) a state legislature naming electors to the Electoral College on some basis other than the popular vote in that state, or 3) Congress refusing to certify electoral results from the states. Partisans on both sides, as well as experts, strongly object to these tactics.
Yet overwhelming disapproval across the board is not sufficient to preclude hardball tactics: we also find strong opposition to strategies that have become widespread in recent years. These include gerrymandering, adoption of policies that would make voting more difficult, and a Senate majority party refusing to consider a president’s Supreme Court nominees. The experts disapprove of all these practices along with substantial majorities in both parties. Yet state legislatures around the country are currently drafting or enacting laws that impose higher burdens on voters. Similarly, states with single-party control are preparing to again draft heavily gerrymandered electoral districts. Professed objections notwithstanding, recent experience provides no basis to expect that voters will punish politicians who pursue these tactics.
The figure also reveals a group of items related to legislative procedures that are arcane in the eyes of most citizens, attract modest expert support (well short of majorities), and generate substantial partisan polarization. This group includes the routine use of the filibuster to block legislative action; a congressional party refusing to raise the borrowing limit, and thus threatening government shutdown and default, as a bargaining strategy; impeachment against a president on grounds of unfitness for office, rather than for a high crime or misdemeanor; and packing the Supreme Court. Two of these items, routine filibusters and government shutdowns, attract bare majority support among Republicans, as does impeachment for unfitness among Democrats. But majorities of experts oppose all these practices, along with even larger shares of one or the other party.
Two hardball moves are supported by majorities of the experts and Democrats in the public sample — granting statehood to Washington, D.C. and Puerto Rico (83% among experts and 62% of Democrats) and abolishing the filibuster in the U.S. Senate (73% and 52%, respectively). However, these items are also the hardball tactics for which partisan polarization is most dramatic — only 11% of Republicans support abolishing the filibuster and only 17% support statehood for D.C. and Puerto Rico. Interestingly, though partisan divisions over statehood have remained relatively stable since 2019, preferences over abolishing the filibuster have flipped. In 2019, roughly 20% of Democrats (Trump opponents) supported abolishing the filibuster whereas nearly half of Republicans (Trump supporters) did. Today, Republicans overwhelmingly favor keeping the filibuster while most Democrats favor ending it. Expert support for abolishing the filibuster has also increased from 47% to 73%.
Expert assessments of likelihoods and threats
We also asked our expert sample to rate the likelihood of some hardball-related events and to assess the consequences of recent changes to electoral law in the states. We first asked our expert respondents to estimate the probability that the following events would occur within the next year:
• The Democratic majority in the Senate abolishing the filibuster rule so it can pass legislation without Republican support.
• The Democrats using their current control of Congress and the presidency to create and fill new seats on the Supreme Court to change the partisan balance of power.
• The Democrats using their control of both chambers of Congress to grant statehood to Washington, D.C. and Puerto Rico.
• A state political party drawing Congressional districts that ensure it will receive a share of seats much larger than its share of votes.
We also asked experts to rate the probability that the following events would occur before the next presidential inauguration (January 20, 2025):
• The Republican Party in the Senate blocking confirmation of an open Supreme Court seat for one or more years.
• The Democratic Party in the Senate eliminating the filibuster for voting rights legislation.
• One or more states adopting multi-member districts.
Finally, we asked experts to rate the probability of the following events occurring during or after the 2024 presidential election:
• Local electoral officials refusing to certify election results that reflect recorded vote totals.
• A state legislature naming electors to the Electoral College other than those designated by the popular vote in that state.
• Congress refusing to certify presidential election results that have been submitted by the states.
The figure below reports the median probability estimate and the density of probability estimates across the available range of 0% to 100% for each scenario among our expert respondents. Items are listed in descending order of estimated median probability. In line with our discussion above, the experts are nearly unanimous in their expectation that state parties will engage in partisan gerrymandering (97%). They also overwhelmingly anticipate Senate Republicans blocking a Supreme Court nomination for at least a year between now and 2025 (72%), a scenario that presumes the Republicans regain control of the Senate in the 2022 midterm elections and/or that the Democrats lack unity in advancing nominations.

According to experts, the next most likely events are associated with the 2024 presidential election: local officials refusing to certify vote counts (55%) and a state legislature naming alternative electors (46%). These expectations are likely based on local- and state-level Republican activism across the country against supposed threats to election integrity. Despite an absence of evidence that maladministration or fraud are widespread, party activists and many Republican politicians are advancing claims that electoral administration and outcomes (when Democrats win) are untrustworthy. That drumbeat appears to have persuaded our experts that, in at least some localities and perhaps some states, the 2024 election results will be rejected. Expectations that Congress would refuse to certify the election result are only slightly lower (39%).
Although experts overwhelmingly favor eliminating the filibuster (see above), they are not sanguine about the prospects for doing so in general or as a targeted maneuver to advance voting rights legislation (40% in either case). The experts attach lower expectations still to prospects for two other constitutional hardball tactics favored by Democrats — granting statehood to Washington, DC and Puerto Rico (30%) and enlarging the Supreme Court (25%). Finally, we asked about the prospects of an electoral change allowing states to use multi-member districts in congressional elections. The experts rate this proposal, much loved by political reformers, as least likely of all (13%).
We also asked experts to assess the effect of the following changes to electoral law on US democracy:
• Reducing the number of ballot drop boxes and increasing restrictions on when and how ballots can be dropped off
• Barring non-election workers from providing food and water to voters waiting in line
• Increasing restrictions on eligibility to vote by mail and the distribution of mail ballots
• Giving state legislatures more control over state election boards
• Empowering state election boards to suspend county election officials
• Preventing counties from offering 24-hour or drive-through early voting
• Requiring voters to provide state-issued ID with absentee ballot applications or absentee ballots
Experts could indicate whether they expected each reform to benefit democracy, have no impact on democracy, or threaten democracy. The figure below summarizes the results. A number of patterns emerge. First, each of these state-level policy changes is regarded by our experts as more damaging than beneficial for democracy. In particular, proposals that would make it more difficult to vote (by restricting ballot drop-off and eligibility to vote by mail) and that could politicize the administration of elections (by increasing state legislative control of election boards and by empowering such boards to suspend local election officials) were regarded as threats to democracy by more than two-thirds of experts and as benefits by less than 10%. Other changes were seen as less consequential, though still potentially harmful. Banning people from bringing food or water to voters waiting in line is regarded as beneficial by only 4% of respondents and as a threat by 41%, but 55% regard these laws as not affecting American democracy. Voter ID requirements and the elimination of 24-hour drive-through voting are regarded as threats by near-majorities and benefits by only a few, but substantial shares of experts regard them as not having much impact.
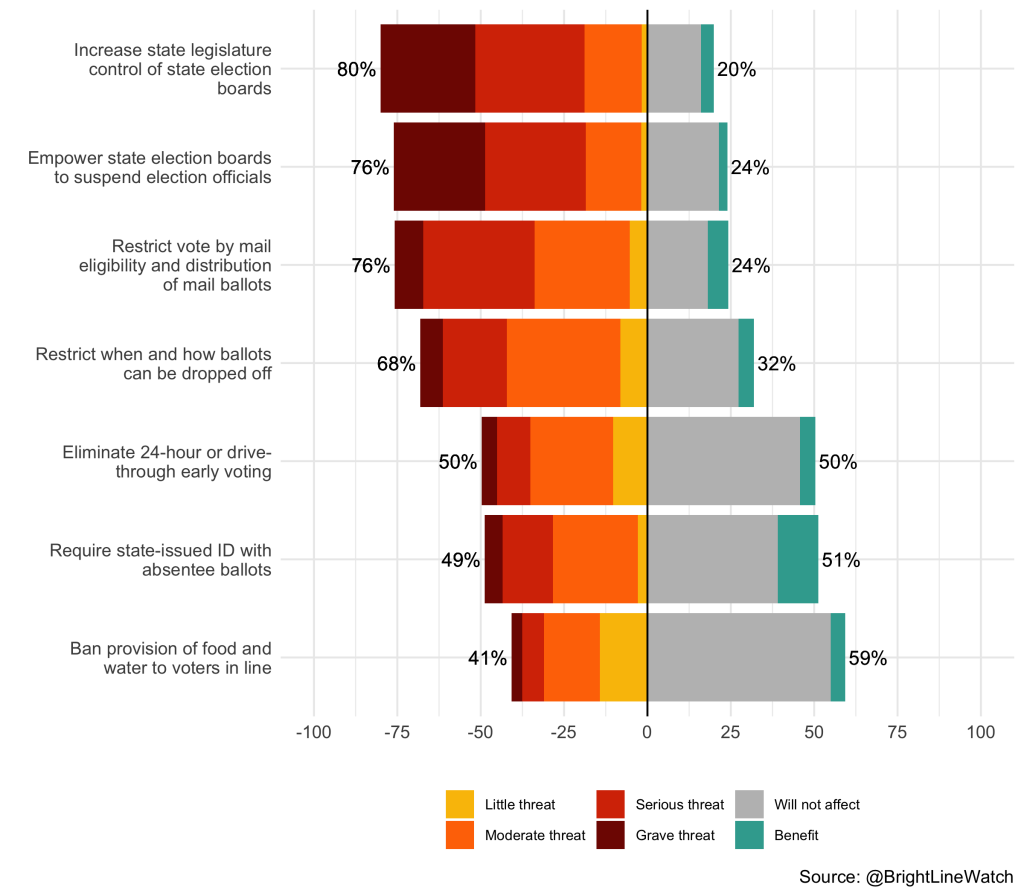
For respondents who expected a threat or a benefit from a given reform, our survey further allowed them to rate its degree (as little, moderate, serious, or grave/extraordinary). The experts perceive the greatest danger from efforts to change electoral administration. Even more than barriers to voting, reforms to increase political control over election boards and local officials are regarded as presenting grave or serious threats to democracy by 58% and 61% of the experts, respectively. Over three quarters of experts also view restrictions on eligibility to vote by mail and the distribution of mail ballots as posing a threat to democracy, though relatively fewer believe that such provisions would present a serious or grave threat (42%).
Maricopa audit experiment
The June 2021 survey included an experiment to test the effects of efforts to undermine acceptance of the result of the 2020 election. Numerous GOP officials at the state and federal level are questioning whether Joe Biden was legitimately elected and using these charges to justify changes to state laws that curtail the independence of local electoral officials, potentially bringing electoral administration under partisan control.
Our experiment focuses on the ongoing Republican Party “audit” of votes in Maricopa County, Arizona. We sought to test how news of a partisan process questioning electoral outcomes would affect confidence in electoral integrity. Maricopa is the largest county in a state that swung from Republican in 2016 to Democratic in 2020. The county conducted multiple audits after the 2020 election, some procedurally uncontroversial, others politicized and contested. The initial audits were automatic, given the closeness of the vote count, and conducted first by the Secretary of State. Subsequently, the county’s Board of Supervisors conducted tests of Maricopa’s vote-counting machines. None of these investigations showed any evidence of problems, but, in March 2021, the Republican caucus in the Arizona State Senate commissioned an additional audit of the Maricopa ballots, hiring a firm with dubious expertise, and whose CEO endorsed conspiracy theories about the election, to conduct the process. At the time that our survey was in the field, the Maricopa “audit” remained incomplete and unresolved.
To estimate the effect of a procedurally legitimate audit and a partisan pseudo-audit on confidence in that result, we randomly assigned our survey respondents to one of three conditions. A third were presented with the following information:
Maricopa County is a large county in Arizona in which Phoenix is located. In the 2020 election, Joe Biden received 49.81% of the vote in Maricopa County and Donald Trump received 47.65% of the vote.
Another third of our participants were provided the basic information above and then asked to read the following news story recounting the uneventful, confirmatory audits:2
Maricopa County has already conducted multiple audits of the 2020 election
Before and after every election, it’s standard procedure in Maricopa County to conduct a “logic and accuracy” test on election equipment. In 2020, those tests turned up no issues. State law also mandates a hand-count audit of a statistically significant sample of ballots after each election to be compared to the machine count. That, too, came up with 100% accuracy, according to county election officials.
In January, after waves of protests, the Maricopa County Board of Supervisors approved two additional audits of election equipment. The board hired two independent firms, Pro V&V and SLI Compliance, which are certified by the U.S. Elections Assistance Commission. The firms conducted their separate audits in February and found no issues.
The audits included tests for malicious software and hardware, source codes, network and internet connectivity, and accuracy to detect vote switching. Observers from both parties were invited to attend, and the audits were live streamed.
Finally, one third of survey respondents were presented with the basic information about Maricopa, then asked to read this news story describing the partisan “audit”:
The Arizona GOP’s Maricopa County audit
Although every state has certified its results, the Republican-controlled state Senate in Arizona has undertaken a full hand recount and audit of the ballots and voting machines in Maricopa, the state’s largest county, a move that has been frequently praised by former president Trump.
By subpoena, the state Senate took possession of 2.1 million ballots and nearly 400 election machines and turned them over to be audited by companies that include one whose CEO promoted debunked election fraud theories after the election. The majority-Republican county board of supervisors vehemently objected to the action and pointed to the multiple audits of ballots and machines that Arizona had already completed that had found no issues.
In response to a subpoena from the state Senate, the county board argued the legislature had no right under state law to access private ballots and election machines. The GOP-led Senate tried to hold the board in contempt, but fell a vote short.
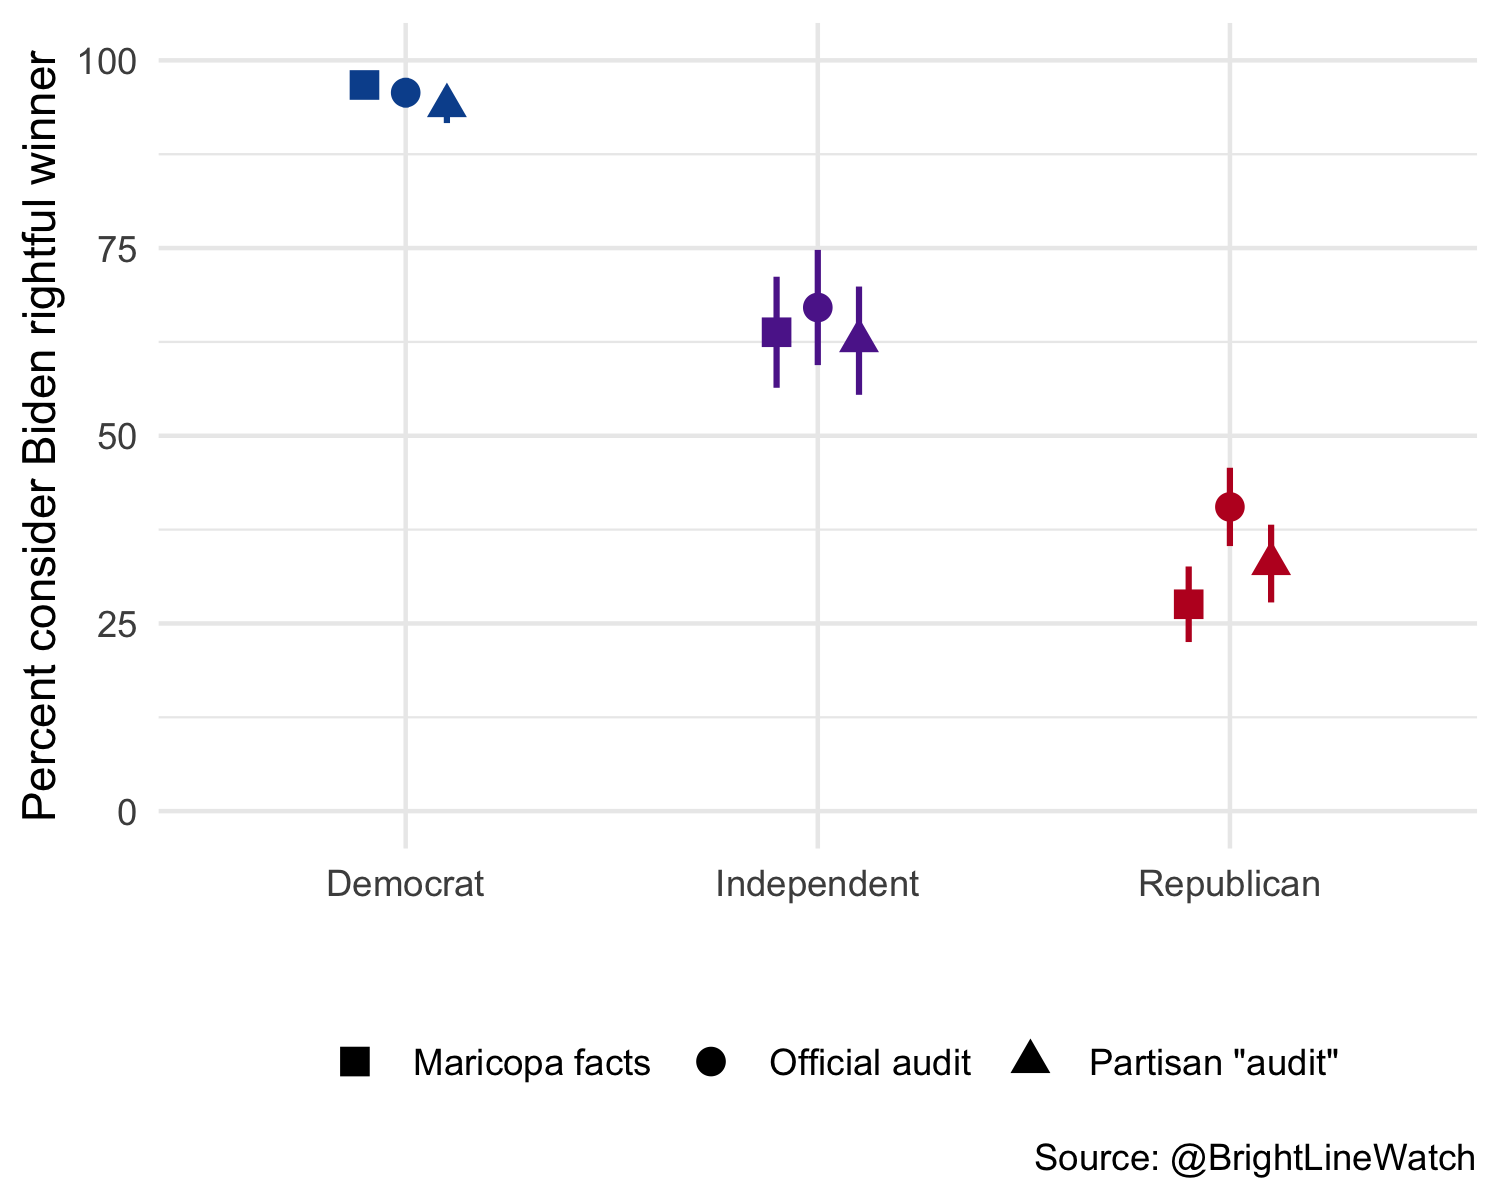
After reading the materials, participants were asked how confident they were that the official count of votes for president in Maricopa County was correct. The figure below illustrates the percentages of respondents who were “very confident” or “somewhat confident” in the count in each condition (as opposed to “not too confident” or “not at all confident”).3
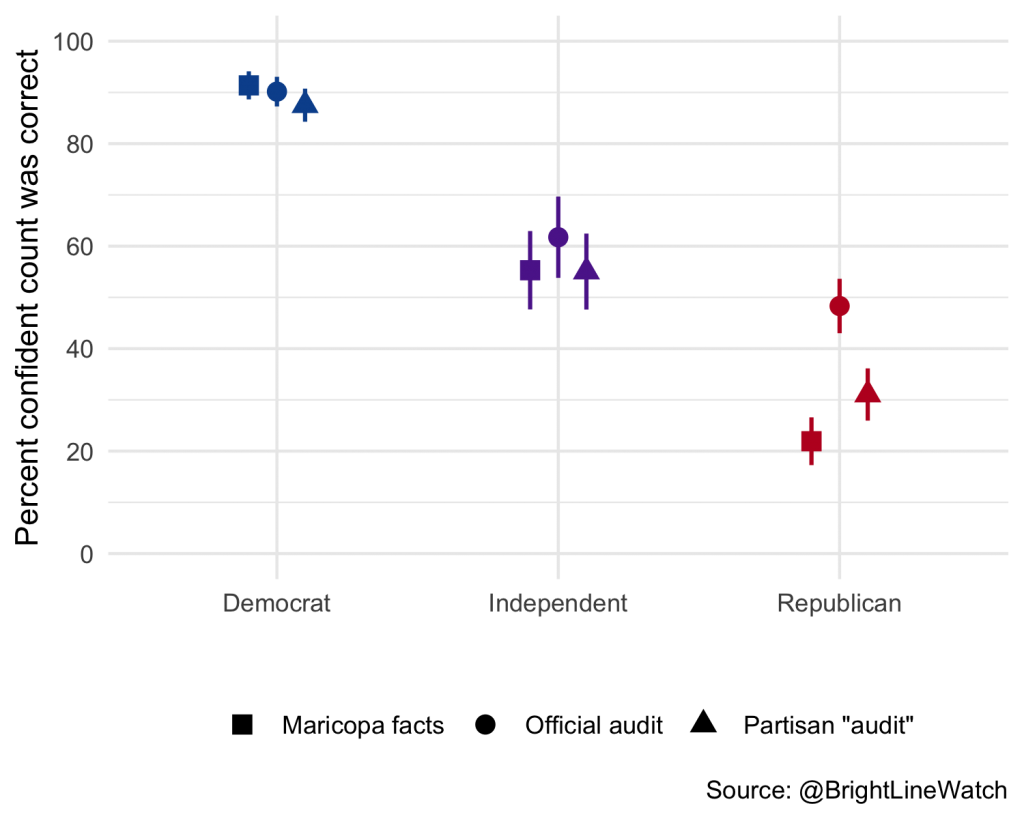
Democratic confidence in the count is high and not measurably affected by information about audits. The treatments have no statistically significant effects among independents either. Among Republicans, however, exposure to information about the official audit more than doubled confidence in the vote count, which increased from 22% to 48%. These results suggest that information about standard processes intended to verify the results of elections can be reassuring to Republicans who might otherwise be sympathetic to the claims of electoral fraud and irregularities that President Trump and his allies so frequently make.
Exposure to the news story about the fracas over the partisan “audit” also increased confidence in the count relative to the baseline condition, but only to 31%, 17 percentage points less than the official audit. The role of Republicans in the process may have been initially reassuring to co-partisans. However, the news article does not discuss the ultimate outcome of the pseudo-audit, which is unknown at this time but widely expected to question the final vote tally. Such an outcome seems more likely to reduce voter confidence among co-partisans than to increase it.
Candidate choice experiment
Six months after leaving office, Donald Trump remains a political lightning rod, particularly his false narratives about the 2020 election and his role in the January 6 insurrection at the U.S. Capitol. We are particularly interested in whether Republican voters’ ardor for Trump, and for candidates who defend him, has cooled since the end of his presidency.
To explore this question, we repeated a candidate choice experiment that we first conducted in our January/February 2021 survey, which asked respondents to choose between paired hypothetical Republican candidates “in an upcoming election.” Each candidate was defined by a profile consisting of their name (which signaled both gender and race/ethnicity), their partisanship (Republican in each case), and their support for or opposition to government spending for COVID relief and for transportation infrastructure, certification of the 2020 presidential election results, and Trump’s second impeachment (which ended with his acquittal by the Senate in February 2021). Each participant in our experiment chose among three pairs of candidates whose attributes (except partisanship) were randomly assigned.4In a given pairing, a participant might be asked to choose between a white Republican woman who favored both spending bills, supported certification of the election, and opposed impeachment and a Hispanic Republican man with similar positions on the spending bills but who opposed both certification and impeachment. The next pairing would present two more candidates with randomly assigned attributes and positions.
The design allows us to estimate the effect of each attribute in the candidates’ profiles on the probability that the respondent would support him or her and how the effects of those attributes differ across different types of respondents. For example, we can estimate the distinct effect of supporting impeachment across Democrats, Republicans, and political independents. Finally, by repeating the experiment we can compare current attitudes with those from last winter to see which values have changed and which remain stable.
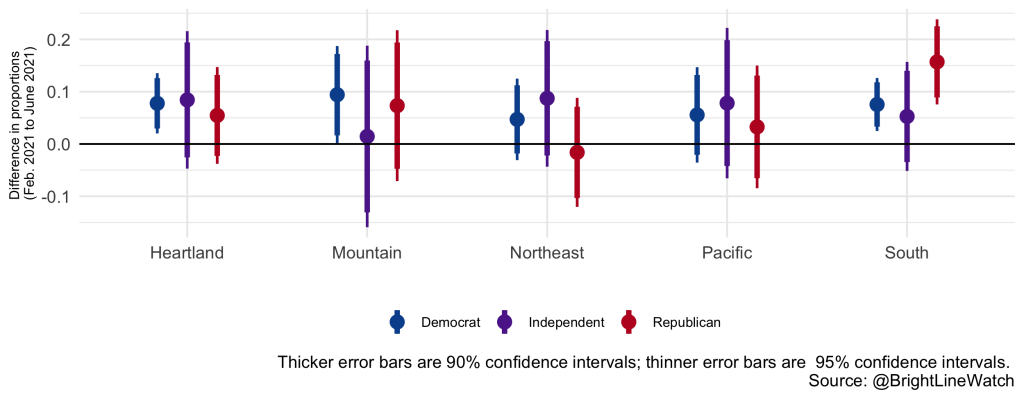
The figure below shows the marginal effect, for Democrats, Republicans, and independents, of a candidate’s race/ethnicity (Black, Latino, or white), gender (woman or man), and policy positions (supporting COVID relief, transportation spending, election certification, and impeachment) on the likelihood of preferring one Republican candidate over another. The circular markers indicate results from the January/February survey; triangular markers indicate the more recent June survey. The estimate for each item, which is known as the Average Marginal Component Effect, can be interpreted as the change in likelihood of voting for that candidate, all else equal, if the candidate moves from the baseline category to the category listed in the figure.
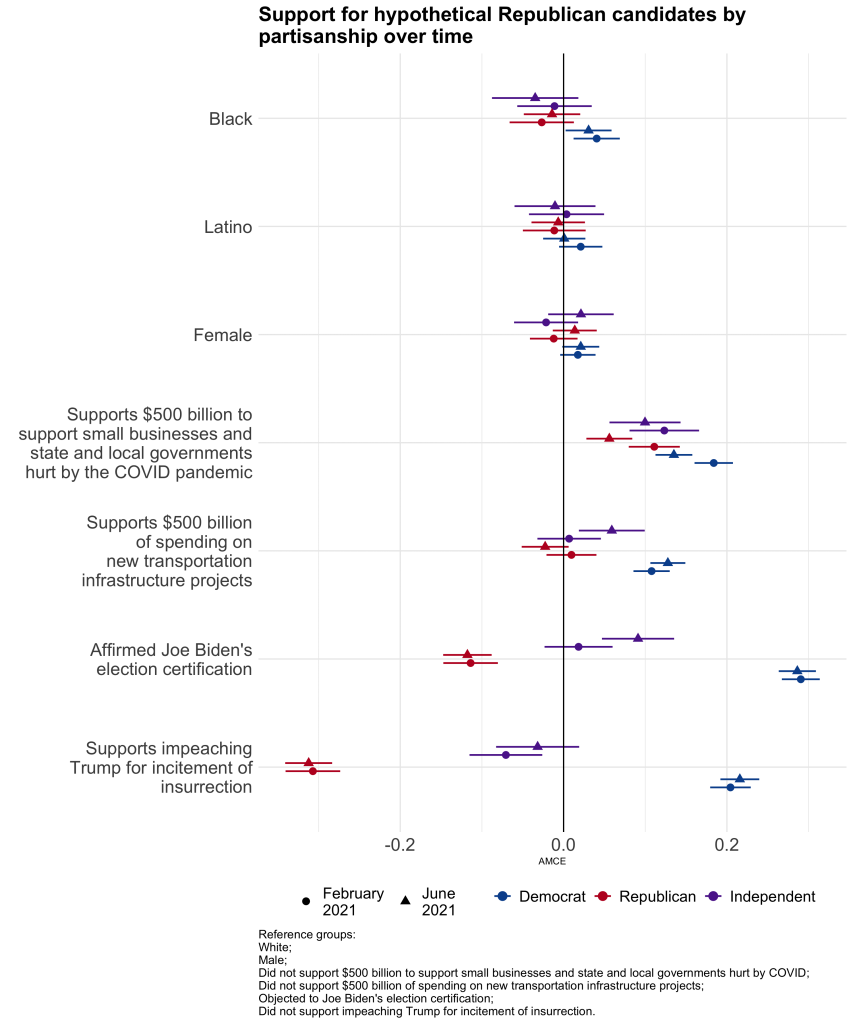
The top of the figure shows the estimates for race/ethnicity and gender. All else equal, Republican participants and independents are slightly less likely to vote for a Black candidate than are Democratic participants, but the scope of the effects here are relatively modest. The effects of candidates’ policy positions are far greater in magnitude than those of personal attributes. Candidates who supported spending on COVID relief are favored over those who opposed it among all groups, with the strongest effects among Democrats (14 points) followed by independents (10 points) and Republicans (6 points). Those effects were even larger in February when the COVID relief issue was more salient (18, 12, and 11 points, respectively). Transportation infrastructure spending is asymmetrically polarized by party: Democrats strongly favor candidates who support it (13 points) whereas Republicans are indifferent (the impact of a candidate’s support for transportation infrastructure spending is statistically indiscernible from zero). Independents, notably, have moved from indifference on infrastructure spending in January/February to support (6 points) in June.
The largest effects by far come from certification of the 2020 election and support for former President Trump’s second impeachment. Democratic participants are vastly more likely to support a candidate who voted to certify the election (29 points) and in favor of impeachment (22 points) than one who opposed these items, whereas Republicans punish each of those positions severely (-12 and 31 points, respectively). Equally striking, neither Democrats nor Republicans have budged since last winter on these issues. The estimated effects in the June experiment are almost identical to what they were last January/February. These issues have lost no salience among committed partisans.
But not everything has remained frozen in the intervening months. In January/February, independents were only 2 points more likely to support a candidate who affirmed the election than one who refused to do so, but now they favor the affirming candidate by 9 points. In January/February, independents punished candidates who supported impeachment by 7 points; in June, that sanction shrank to 3 points (although this latter shift falls short of statistical significance).
In general, our repeated candidate choice experiment shows remarkable stasis among partisans, who are both miles apart and solidly locked into their preferences. But we also find some discernible movement among independents, who have moved in the direction of positions favored by Democrats on infrastructure spending and on the legitimacy of the 2020 election.
Secession
President Biden made it a signature goal to reunite a country scarred by partisan and regional divides. Our surveys seek to assess whether the animus that characterized the Trump era persists. We therefore repeated a question from our January/February 2021 survey asking respondents in our public sample about their support for breaking up the United States. As in last winter’s survey, we asked respondents the following:
“Would you support or oppose [your state] seceding from the United States to join a new union with [list of states in new union]?” 5
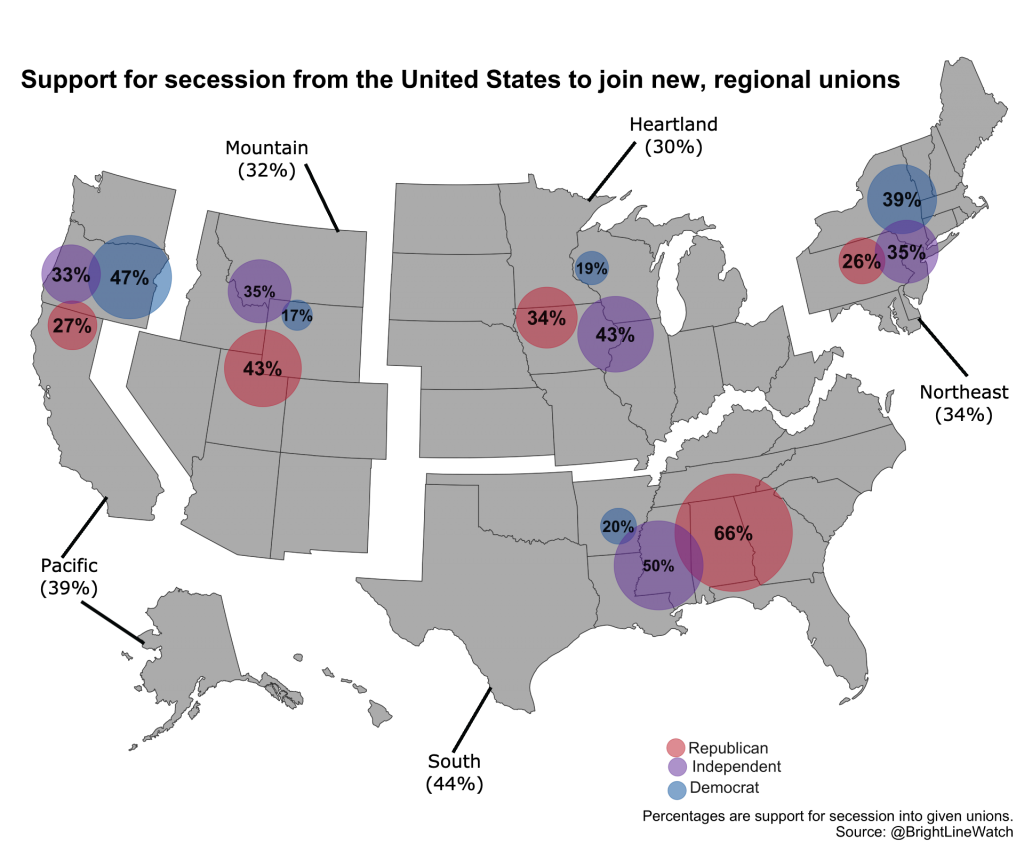
We constructed five prospective new unions and inserted the relevant states for respondents into the question wording above. For example, a participant from California in our survey would be asked about joining a new union along with Washington, Oregon, Hawaii and Alaska. These sets are provided below:
• Pacific: California, Washington, Oregon, Hawaii, and Alaska
• Mountain: Idaho, Montana, Wyoming, Utah, Colorado, Nevada, Arizona, and New Mexico
• South: Texas, Oklahoma, Arkansas, Louisiana, Mississippi, Alabama, Georgia, Florida, South Carolina, North Carolina, Virginia, Kentucky, and Tennessee
• Heartland: Michigan, Ohio, West Virginia, Illinois, Indiana, Minnesota, Wisconsin, Iowa, Missouri, North Dakota, South Dakota, Kansas, and Nebraska
• Northeast: Maine, New Hampshire, Vermont, Massachusetts, Rhode Island, Connecticut, New York, New Jersey, Pennsylvania, Maryland, Delaware, and the District of Columbia
As in our previous report, we caution that this survey item reflects initial reactions by respondents about an issue that they are very unlikely to have considered carefully. Secession is a genuinely radical proposition and expressions of support in a survey may map only loosely onto willingness to act toward that end. We include the question because it taps into respondents’ commitments to the American political system at the highest level and with reference to a concrete alternative (regional unions).
Support for secession under the specific hypothetical unions format is illustrated in the map below. As in the previous survey, levels of expressed support for secession are arrestingly high, with 37% of respondents overall indicating willingness to secede. Within each region, the dominant partisan group is most supportive of secession. Republicans are most secessionist in the South and Mountain regions whereas it is Democrats on the West Coast and in the Northeast. In the narrowly divided Heartland region, it is partisan independents who find the idea most attractive.
These patterns are consistent from our January/February survey, but the changes since then are troubling. Our previous survey was fielded just weeks after the January 6 uprising. By this summer, we anticipated, political tempers may have cooled — not necessarily as a result of any great reconciliation but perhaps from sheer exhaustion after the relentless drama of Trump. For instance, the historian Heather Cox Richardson posited that sustained consideration of the Big Lie narrative would diminish political ardor among Trump supporters, which she related to waning popular support for secession in the Confederacy during the spring of 1861.
Yet rather than support for secession diminishing over the past six months, as we expected, it rose in every region and among nearly every partisan group. The jump is most dramatic where support was already highest (and has the greatest historical precedent) — among Republicans in the South, where secession support leapt from 50% in January/February to 66% in June. Support among Republicans in the Mountain region increased as well, by 7 points, from 36% to 43%. Among Democrats in the West, a near-majority of 47% (up 6 points) supports a schism, as do 39% (up 5 points) in Northeast. Support jumped 9 points among independents in the Heartland as well, reaching 43%. Even subordinate partisan groups appear to find secession more appealing now than they did last winter, though only increases for Democrats in the South, Heartland, and Mountain regions are statistically discernible at the 0.05 significance level. The broad and increasing willingness of respondents to embrace these alternatives is a cause for concern.
Overall performance of democracy
As with prior surveys, we asked our respondents to rate the overall performance of American democracy on a 100-point scale. The figure below reports the average ratings for Democrats and Republicans in the public sample and for experts going back to February 2017.
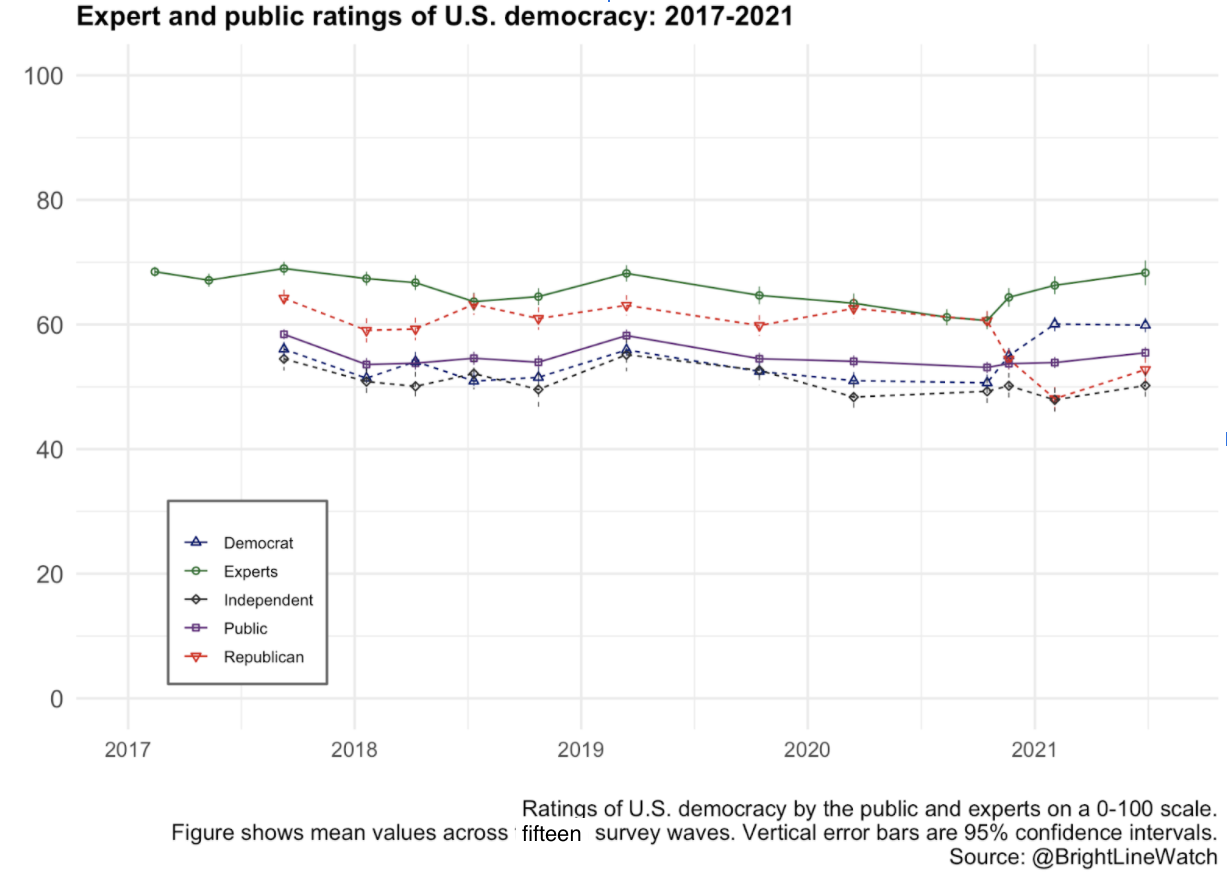
The experts (green) consistently rate American democracy more positively than the public does, but also broadly regarded Trump’s presidency as a threat to democracy. Democracy ratings among the experts accordingly jumped in early 2019 after the Republican Party lost control of the U.S. House and have risen again, from 61 to 68 on the 100-point scale, in surveys conducted after he lost the White House. Assessments among the public overall (purple) are relatively stable, although they, too, have inched up slightly in recent surveys, with a net increase from 53 to 55 since last October, on the eve of the last election. The public’s overall rating masks variance at the partisan level. Republicans consistently rated U.S. democracy higher than Democrats throughout Trump’s presidency, but their ordering switched after Trump’s defeat to Joe Biden. In the June 2021 survey, democracy ratings rose slightly relative to January/February 2021 among Republicans (48 to 53) and did not change significantly among independents (48 to 50) or Democrats (60 in both surveys).
Events
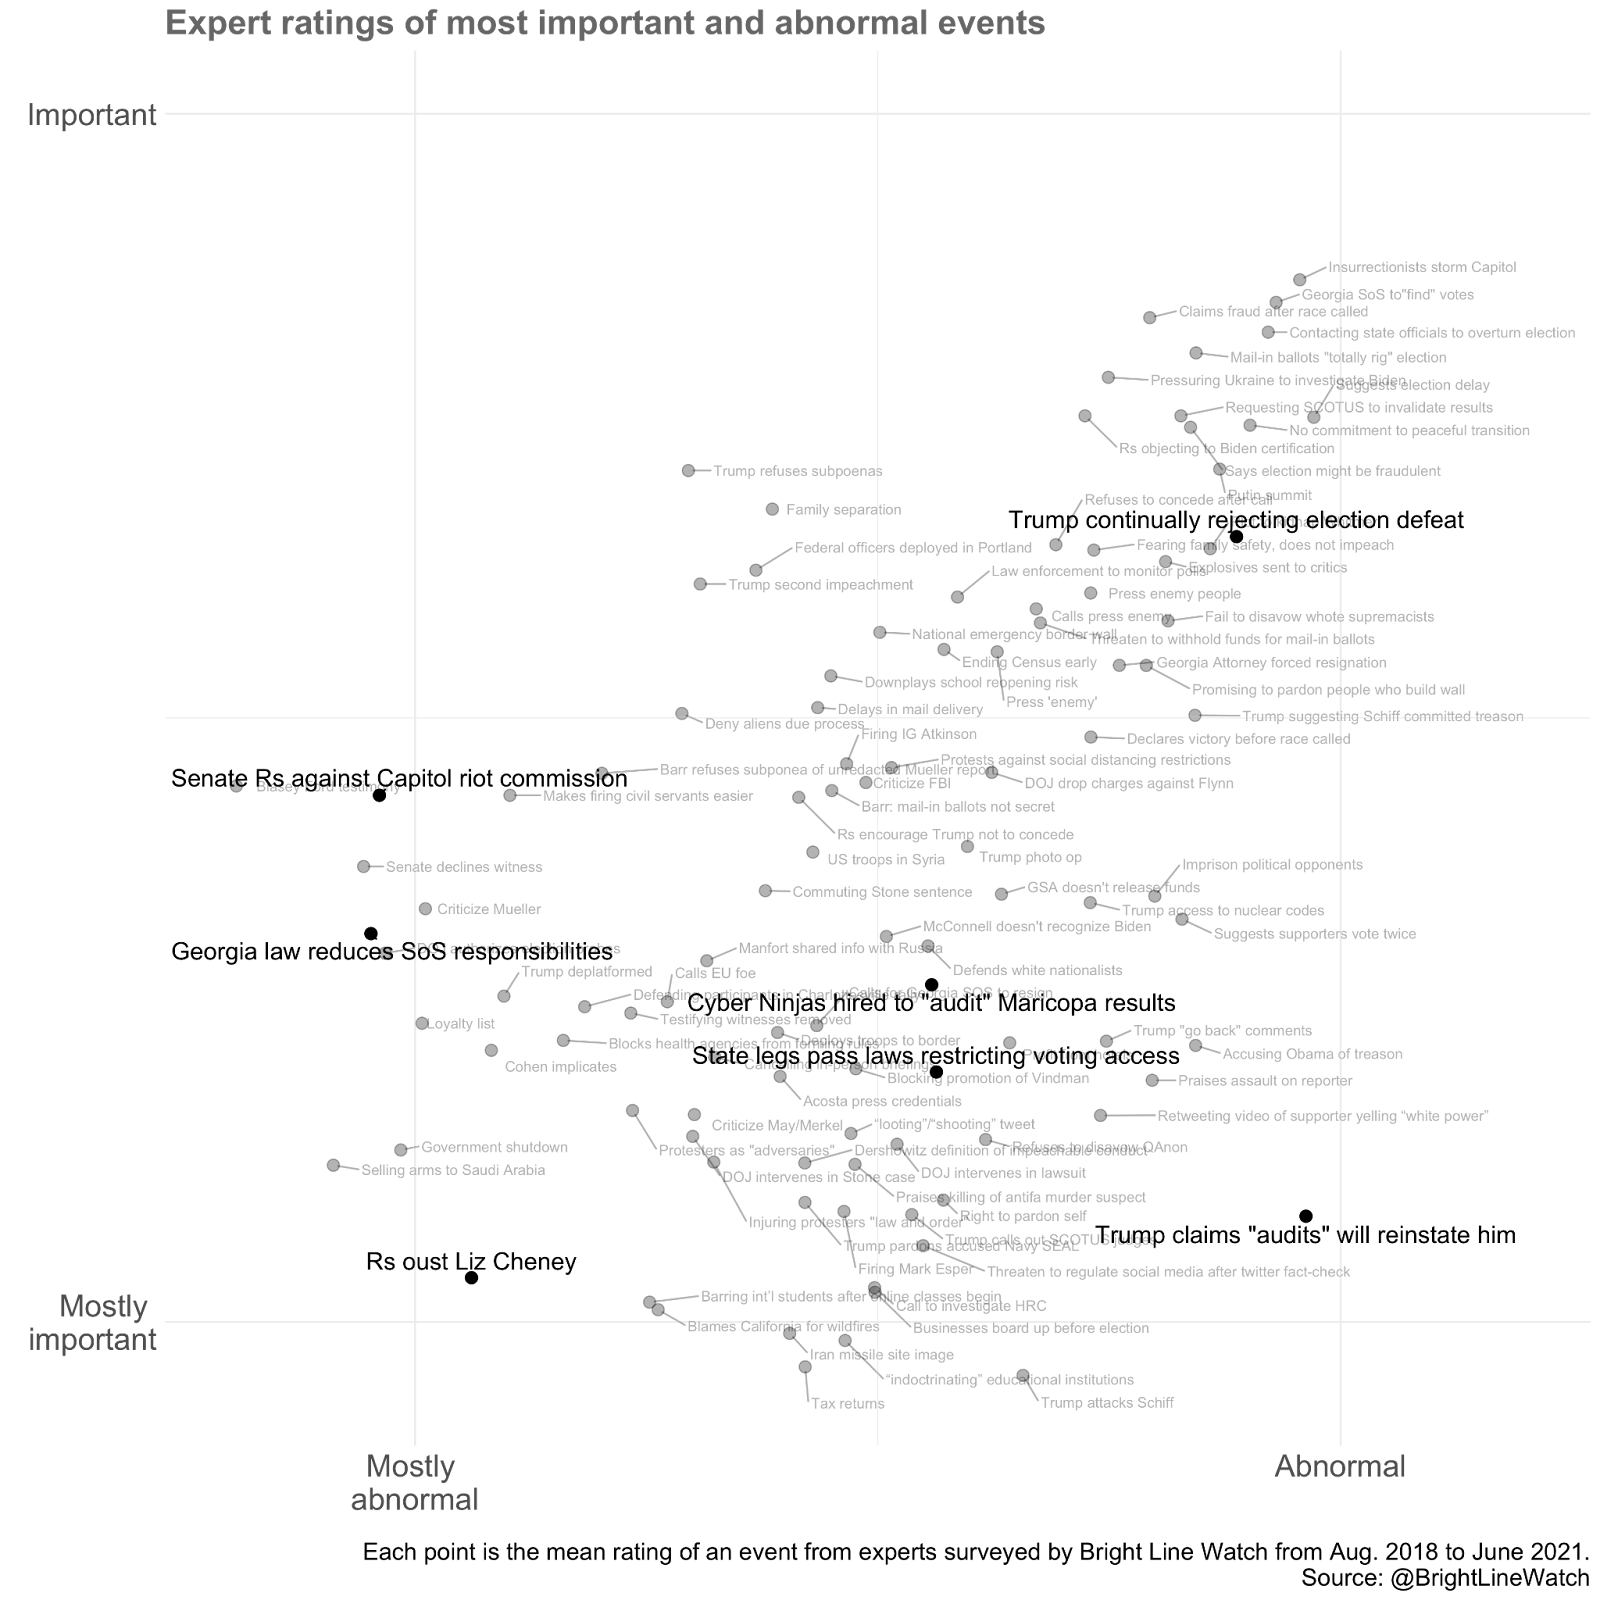
We continued to survey experts about the normality and importance of events that have taken place in recent months. The ratings they provided are plotted on the figure below, which identifies a number of events that experts rate as relatively normal and important (e.g., the U.S. sending vaccines abroad), one event that experts rate as relatively abnormal and unimportant (Donald Trump’s use of a since-shuttered blog to circumvent social media bans), and a number of events rated as both abnormal and important. We focus on the last category, which appears in the upper right quadrant of the figure.

The area shaded in gray above represents the most extreme cases — the events experts rated as mostly abnormal to abnormal and as mostly important to important on average. We zoom in on that area in the figure below, which plots events in that range that experts rated in our most recent survey wave along with all the comparable events experts rated during the Trump presidency. Each abnormal and important event identified in this survey concerns the results of the 2020 election, the January 6 insurrection, or subsequent efforts to change election laws at the state level. Trump’s continued rejection of the legitimacy of his election defeat stands out to experts as the most abnormal and important. However, most concern actions taken by other party actors — five of the seven events describe steps taken by other Republicans at the local, state, or federal level rather than Trump or administration officials.
Bright Line Watch surveys on the state of America’s democracy, June 2021
From June 26-July 2, 2021, Bright Line Watch conducted its fifteenth survey of academic experts, and tenth of the general public, on the quality of democracy in the United States. Our public sample consisted of 2,750 survey participants from the YouGov sample who were selected and weighted to be representative of the U.S. adult population. We also surveyed 327 political science experts across a diverse range of subfields (3% of solicited invitations). Our email list was constructed from the faculty list of U.S. institutions represented in the online program of the 2016 American Political Science Association conference and updated by reviewing department websites and job placement records from Ph.D. programs in the period since.
All estimates shown in the report used weights provided by YouGov. Our expert sample is traditionally unweighted because we do not collect demographic data to protect anonymity. Error bars in our graphs represent 95% confidence intervals. Data are available here.
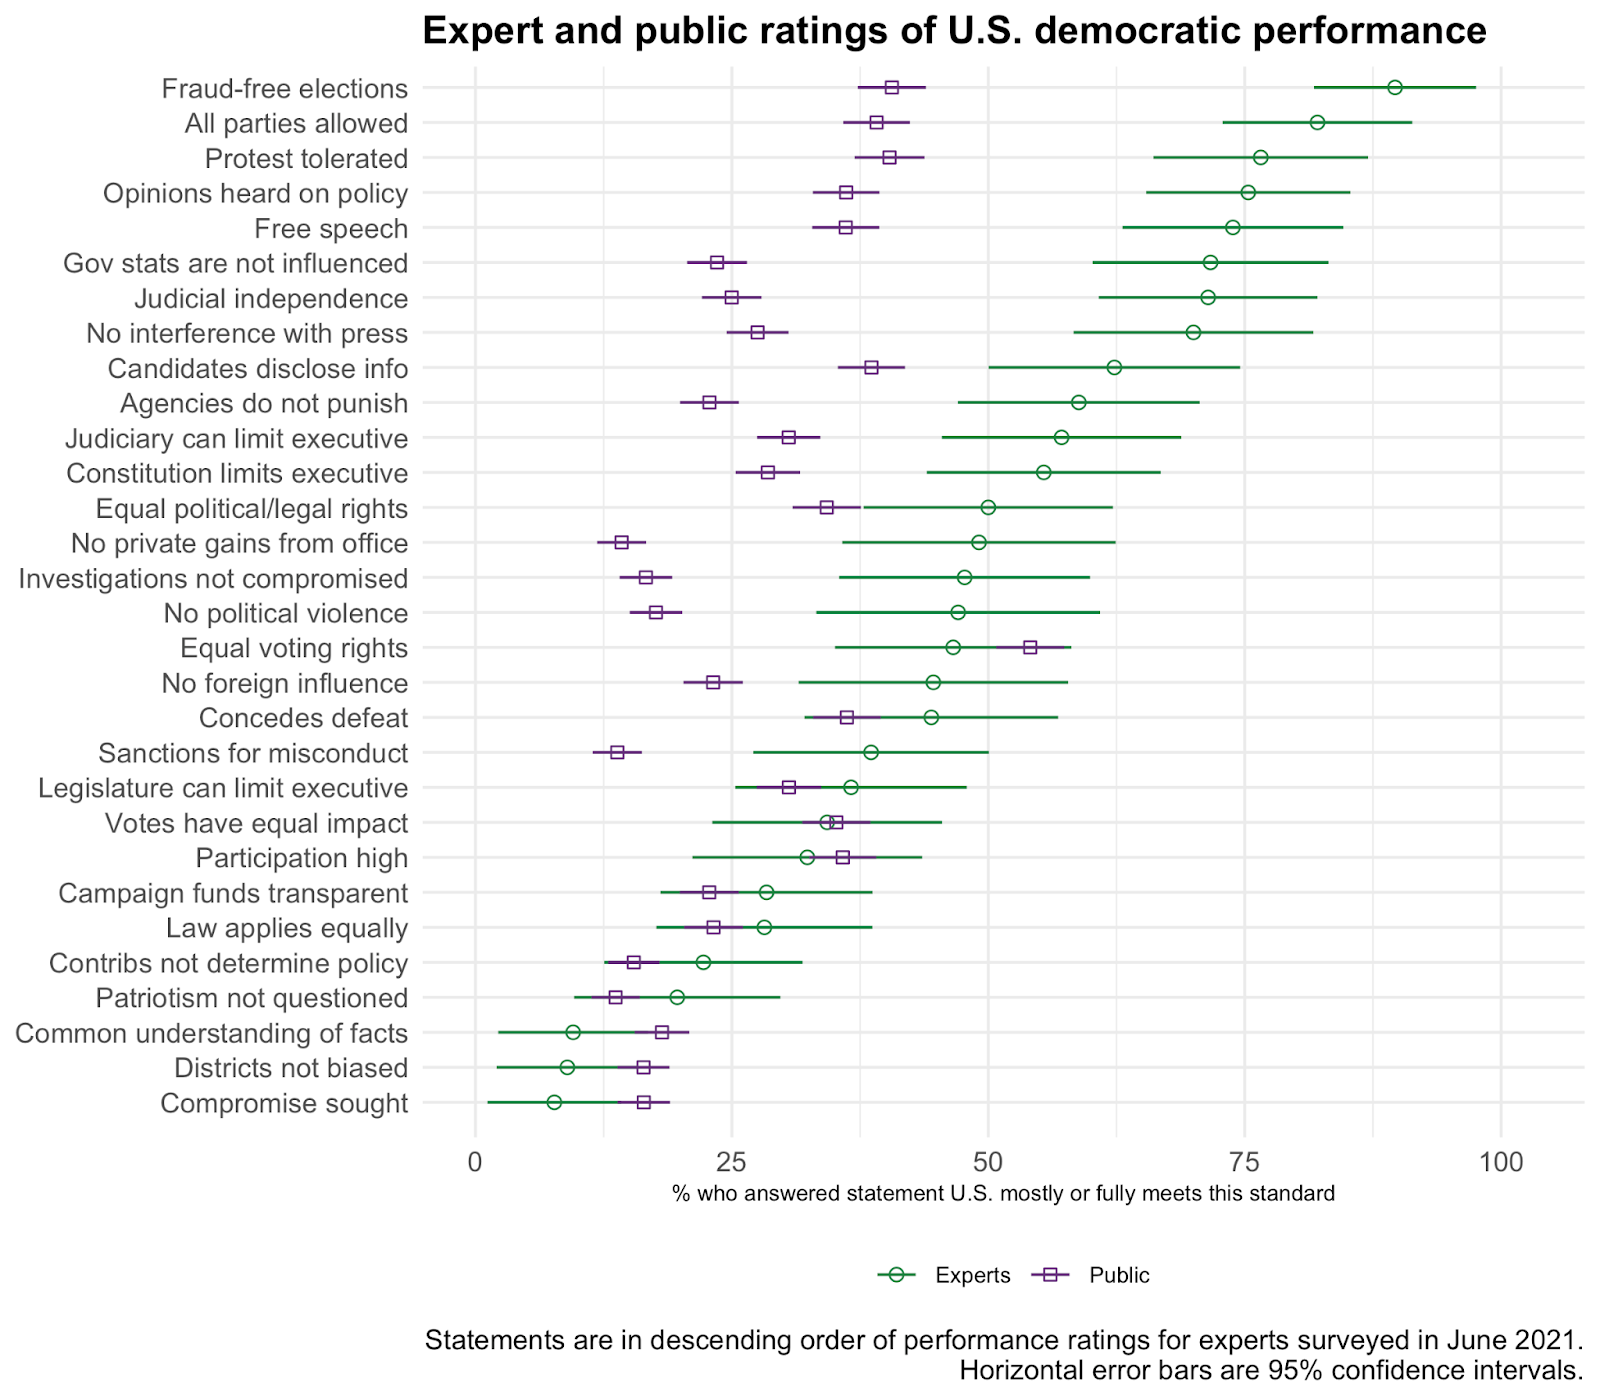
Both the expert and public samples in Wave 15 responded to a battery of questions about democratic performance in the United States. Afterward, they were asked to evaluate the quality of American democracy overall on a 100-point scale. Experts were also asked to evaluate the quality of democracy in their state on the same 0–100 scale. Expert respondents were then asked to respond to three additional batteries: one in which they were presented with a list of political events and asked to rate them on normalcy and importance, another in which they were asked to evaluate hypothetical scenarios (lists of both are below), and a final set of questions about the degree to which events posed a threat to democracy.
How well do the following statements describe the United States as of today?
• The U.S. does not meet this standard
• The U.S. partly meets this standard
• The U.S. mostly meets this standard
• The U.S fully meets this standard
1. Elections are conducted, ballots counted, and winners determined without pervasive fraud or manipulation
2. All adult citizens have equal opportunity to vote
3. Voter participation in elections is generally high
4. Elections are free from foreign influence
5. The geographic boundaries of electoral districts do not systematically advantage any particular political party
6. All votes have equal impact on election outcomes
7. Parties and candidates are not barred due to their political beliefs and ideologies
8. All adult citizens enjoy the same legal and political rights
9. Government does not interfere with journalists or news organizations
10. Government effectively prevents private actors from engaging in politically-motivated violence or intimidation
11. Government protects individuals’ right to engage in unpopular speech or expression
12. Government protects individuals’ right to engage in peaceful protest
13. Government officials are legally sanctioned for misconduct
14. Government officials do not use public office for private gain
15. Government agencies are not used to monitor, attack, or punish political opponents
16. Even when there are disagreements about ideology or policy, political leaders generally share a common understanding of relevant facts
17. Executive authority cannot be expanded beyond constitutional limits
18. The legislature is able to effectively limit executive power
19. The judiciary is able to effectively limit executive power
20. The elected branches respect judicial independence
21. Elected officials seek compromise with political opponents
22. Political competition occurs without criticism of opponents’ loyalty or patriotism
23. Information about the sources of campaign funding is available to the public
24. Public policy is not determined by large campaign contributions
25. Citizens can make their opinions heard in open debate about policies that are under consideration
26. Citizens have access to information about candidates that is relevant to how they would govern
27. Law enforcement investigations of public officials or their associates are free from political influence or interference
28. Government statistics and data are produced by experts who are not influenced by political considerations
29. The law is enforced equally for all persons
30. Politicians who lose free and fair elections will concede defeat
Political events questions
In this series of questions, we ask how normal or abnormal and how important or unimportant recent political events are.
Is this normal or abnormal?
• Normal
• Mostly normal
• Borderline normal
• Mostly abnormal
• Abnormal
Is this unimportant or important?
• Unimportant
• Mostly unimportant
• Semi-important
• Mostly important
• Important
1. House Republicans oust Liz Cheney from leadership for calling out Trump’s false election claims
2. House votes to remove Marjorie Taylor Greene from committees for promoting conspiracy theories
3. Cuomo’s top aides admit state hid data on nursing home deaths
4. Withdrawal of US troops from Afghanistan
5. US rejoins Paris climate agreement
6. Congress passes COVID relief package on party-line votes in both House and Senate
7. Major League Baseball moves its 2021 All-Star Game out of Atlanta to protest Georgia voting reform bill
8. Derek Chauvin is convicted of murdering George Floyd
9. New CDC guidelines endorse fully vaccinated individuals not wearing masks in most places
10. A new Georgia law reduces responsibilities for Secretary of State Brad Raffensperger
11. Senate Republicans block a plan for an independent commission on Capitol riot
12. Trump launches new communications platform after being banned from Twitter, Facebook [deleted FB oversight, didn’t actually uphold it as such but instead kicked it back to company]
13. Biden administration imposes new economic sanctions on Russia over cyberspying
14. US sends initial allotment of 25 million vaccines abroad
15. Biden declares mass killing of Armenians a genocide
16. Biden, speaking with Netanyahu, asserts Israel’s ‘right to defend itself’
17. Biden administration increases support for managing arrival of unaccompanied children at border
18. Texas Democrats walk out of state legislature over restrictive Republican voting law
19. Biden meets with Mexican president amid migration issues
20. Biden visits Tulsa for the centennial of the Tulsa Race Massacre
21. House Democrats pass elections bill, H.R.1
22. Biden calls for an investigation into the possibility that COVID leaked from a Chinese laboratory
23. Former President Trump continues to publicly reject the legitimacy of his election defeat
24. Former President Trump promotes the idea that he will be “reinstated” in office after “audits” this summer
25. Arizona Republicans hire a firm called Cyber Ninjas to conduct an “audit” of the Maricopa County election results in 2020
26. Legislatures in Georgia, Texas, and other states pass laws creating new restrictions on voting access
Additional figures
Support for constitutional hardball tactics — expert versus public attitudes

Support for constitutional hardball tactics — public attitudes by partisan identification
Maricopa County audit experiment — Results for “Biden rightful winner” question
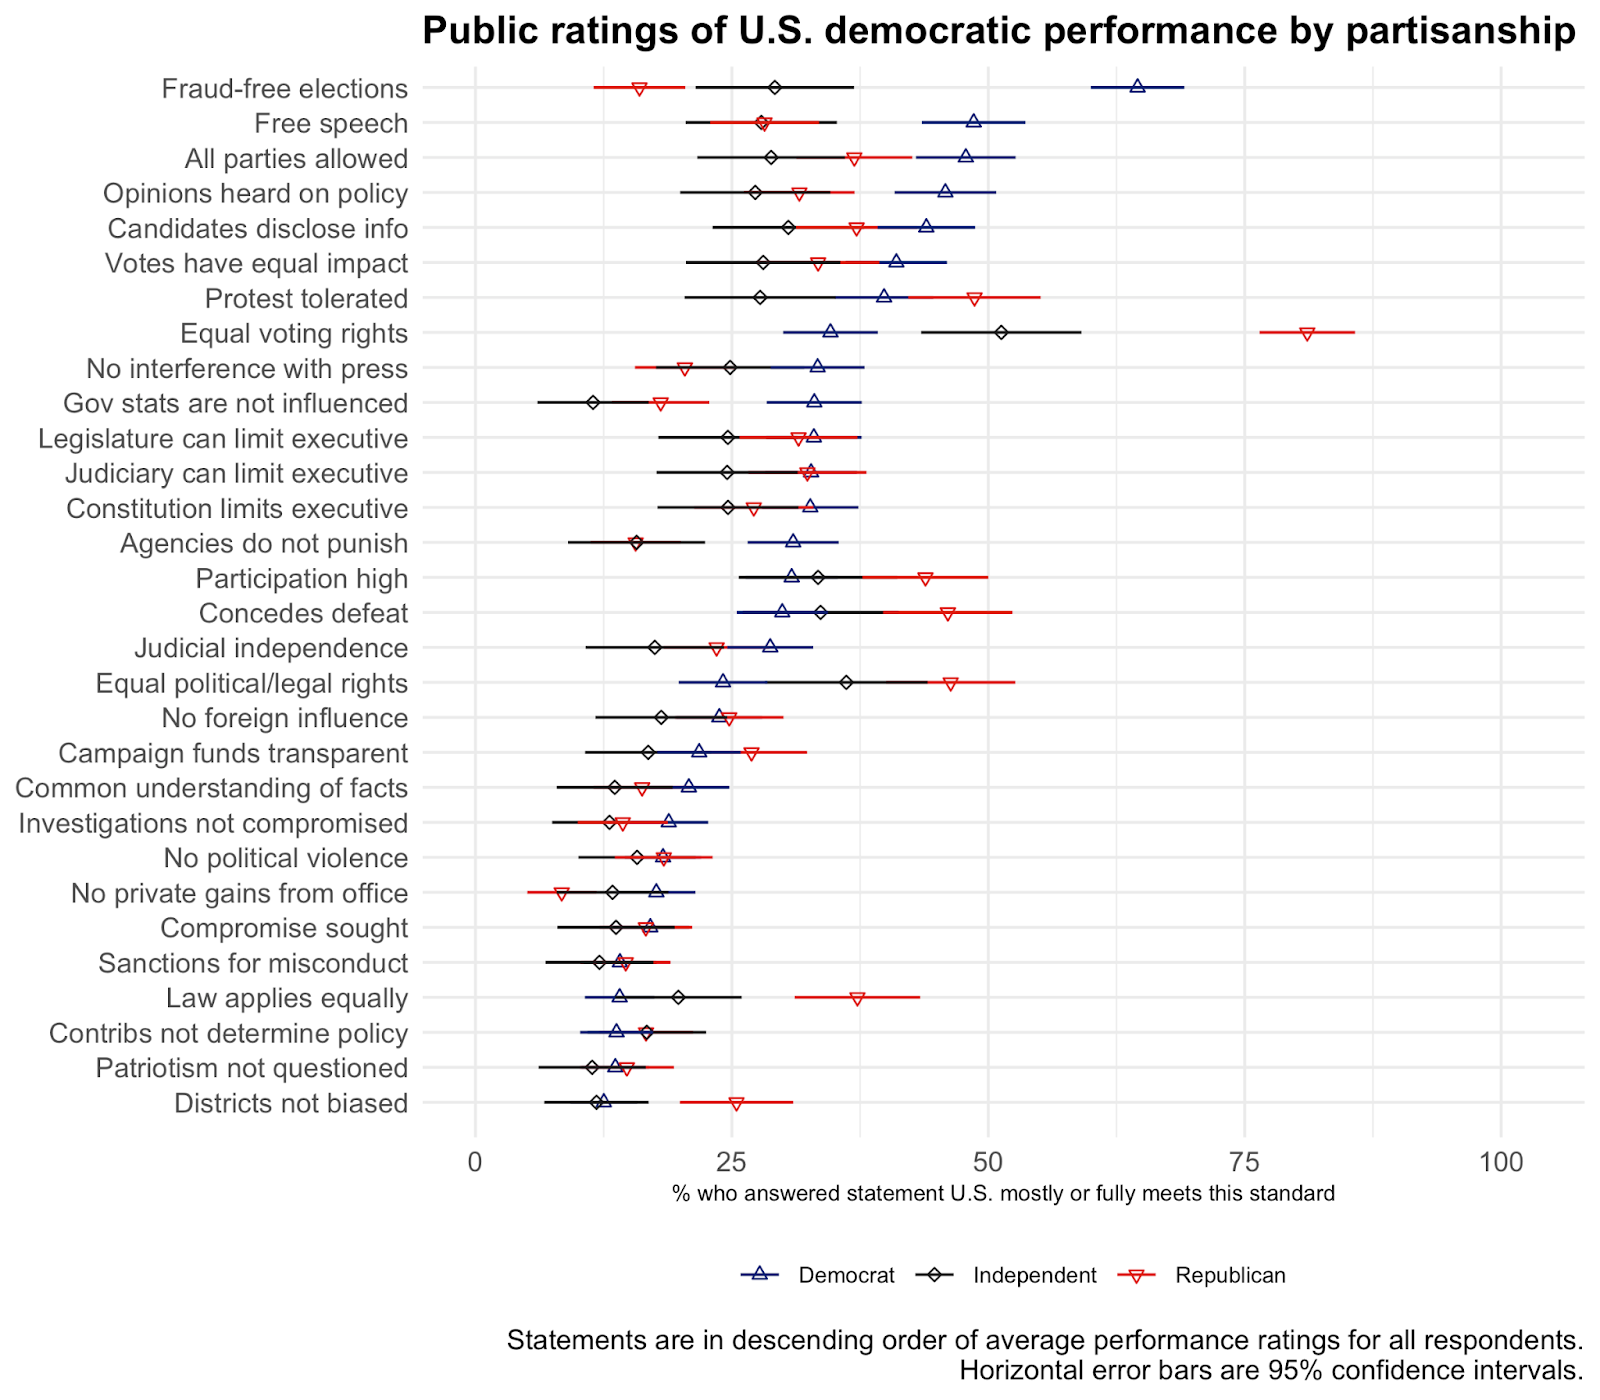
Performance across dimensions of democracy
Notes
1. The survey firm, YouGov, administered our public survey from June 16–26, 2021. We collected responses from 2,750 Americans over this period. From June 16, 2021 to July 2, 2021, we surveyed 327 political scientists who constitute our expert sample.
2. These news accounts were taken from The Arizona GOP’s Maricopa County audit: What to know about it (CBS, May 9, 2021). Text from these news stories were condensed to produce more compact readings for our survey participants.
3. Participants were also asked whether they considered Joe Biden to be the rightful winner of the vote in Maricopa County. Responses were similar to those for confidence and are shown in the Appendix.
4. Democratic legislators uniformly supported certification and impeachment so we tested support for certification and impeachment only among hypothetical Republican candidates, who might plausibly have taken different positions.
5. The response options were: Strongly support, Somewhat support, Somewhat oppose, Strongly oppose. For simplicity, we group responses in the map by support versus opposition.
http://brightlinewatch.org/


