

BY JEFFREY GOTTFRIED, AMY MITCHELL, MARK JURKOWITZ AND JACOB LIEDKE
From the economic upheaval of the digital age to the rise of political polarization and the COVID-19 pandemic, journalism in America has been in a state of turmoil for decades. While U.S. journalists recognize the many challenges facing their industry, they continue to express a high degree of satisfaction and fulfillment in their jobs, according to an extensive new Pew Research Center survey of nearly 12,000 working U.S.-based journalists.
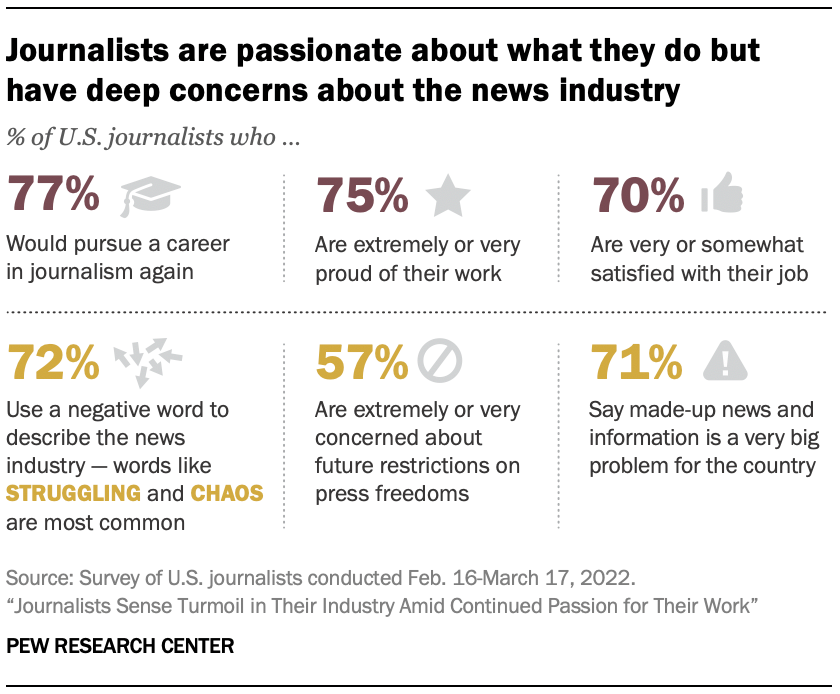
Seven-in-ten journalists surveyed say they are “very” or “somewhat” satisfied with their job, and an identical share say they often feel excited about their work. Even larger majorities say they are either “extremely” or “very” proud of their work – and that if they had to do it all over again, they would still pursue a career in the news industry. About half of journalists say their job has a positive impact on their emotional well-being, higher than the 34% who say it is bad for their emotional well-being.
At the same time, however, journalists recognize serious challenges in the news media more broadly. Indeed, when asked to describe their industry in a single word, nearly three-quarters of journalists surveyed (72%) use a word with negative connotations, with the most common responses being words that relate to “struggling” and “chaos.” Other, far less common negative words include “biased” and “partisan,” as well as “difficult” and “stressful.” (See Chapter 1 for more detailed figures and the methodology for more details about the question asked.)
The survey of 11,889 U.S. journalists, conducted Feb. 16-March 17, 2022, identified several specific areas of concern for journalists, including the future of press freedom, widespread misinformation, political polarization and the impact of social media.
More than half of journalists surveyed (57%) say they are “extremely” or “very” concerned about the prospect of press restrictions being imposed in the United States. And about seven-in-ten journalists (71%) say made-up news and information is a very big problem for the country, higher than the 50% of U.S. adults who say the same. At the same time, four-in-ten journalists say that news organizations are generally doing a bad job managing or correcting misinformation.
A large majority of journalists say they come across misinformation at least sometimes when they are working on a story, and while most say they are confident in their ability to recognize it, about a quarter of reporting journalists (26%) say they have unknowingly reported on a story that was later found to contain false information.
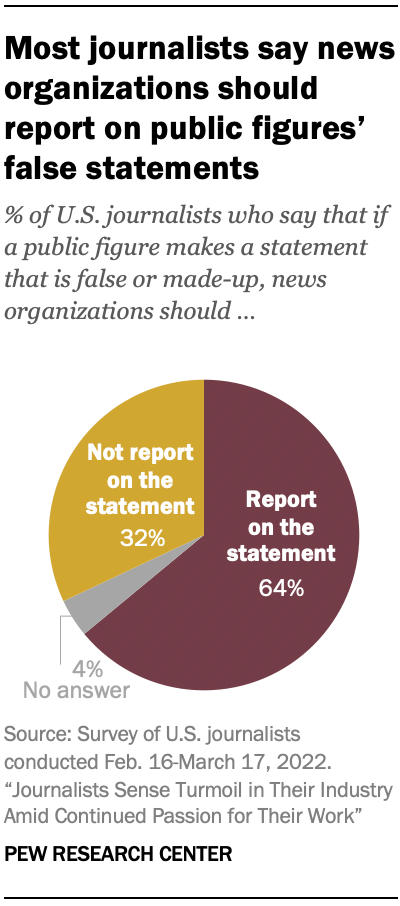
How to report on false statements has become a vexing question for journalists amid a turbulent political climate. The survey asked journalists what they think is the best approach to coverage when a public figure makes a false statement. By two-to-one, journalists are more likely to say the best approach is to “report on the statement because it is important for the public to know about” (64%) rather than to “not report on the statement because it gives attention to the falsehoods and the public figure” (32%).
Still, there is no consensus that opposing views always warrant equal coverage. What historically may have been considered a standard norm of journalism (and even a requirement for broadcast stations in their election coverage) seems, in today’s political environment, to be facing a reevaluation as heated debate ensues around the issue of “bothsidesism” – whether news outlets should be committed to always giving equal attention to all sides of an issue.
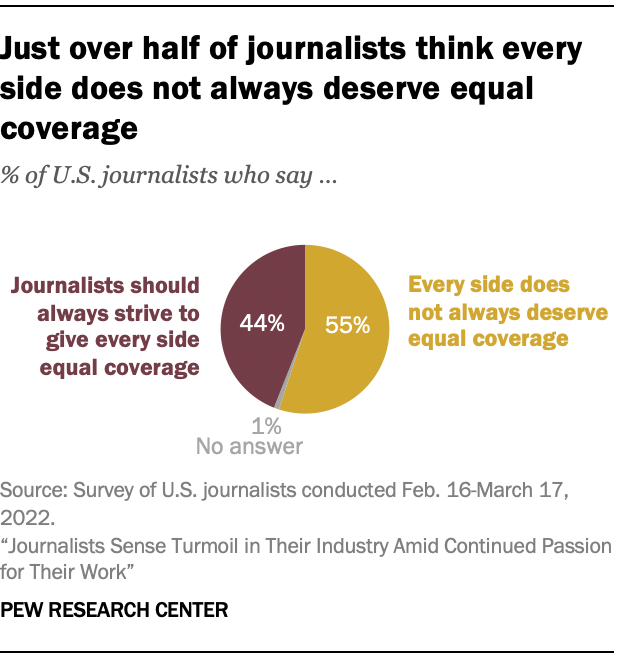
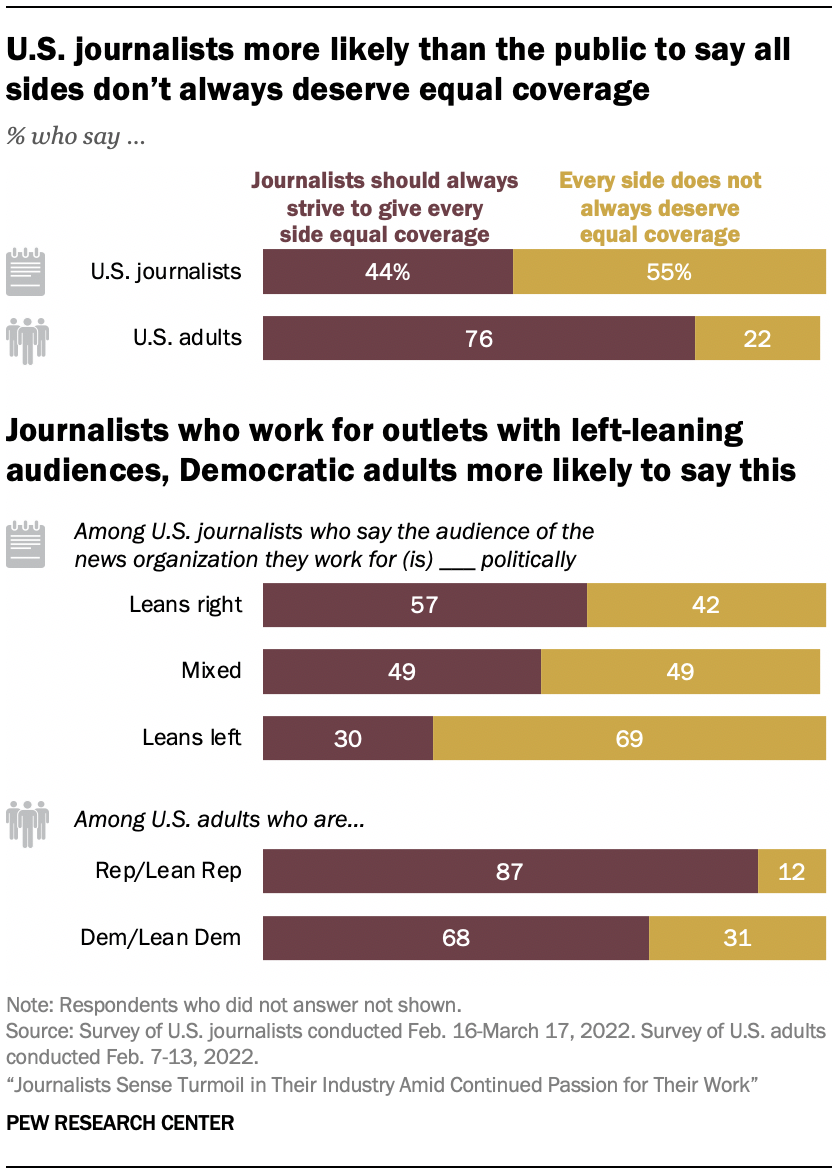
A little over half of journalists surveyed (55%) say that in reporting the news, every side does not always deserve equal coverage, greater than the share who say journalists should always strive to give every side equal coverage (44%).
On the other hand, journalists express wide support for another long-standing norm of journalism: keeping their own views out of their reporting. Roughly eight-in-ten journalists surveyed (82%) say journalists should do this, although there is far less consensus over whether journalists meet this standard. Just over half (55%) think journalists are largely able to keep their views out of their reporting, while 43% say journalists are often unable to.
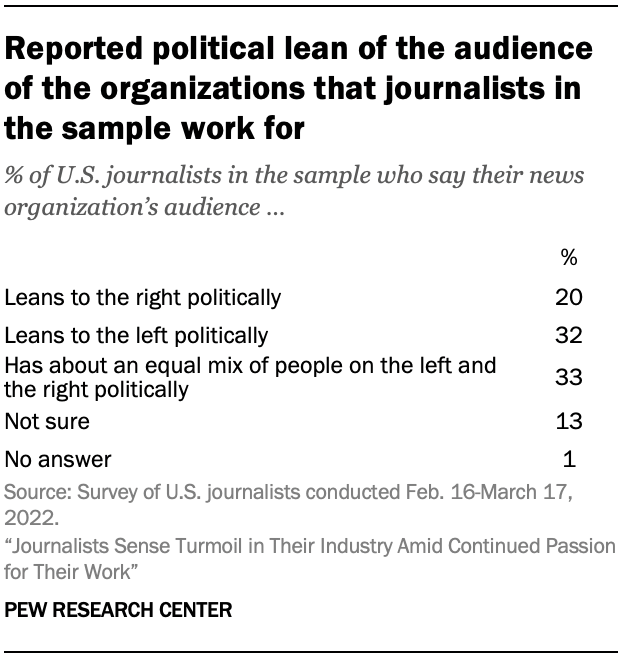
Some of journalists’ views – such as whether every side deserves equal coverage – are connected to the ideological composition of their audiences. Journalists were asked about the political leanings of the audience at the organization where they work (or the main one they work for if they work for more than one), and roughly half say that their audience leans predominantly to the left (32%) or right (20%). An additional third say their organization has a more politically mixed audience, while 13% are unsure.

Even as they recognize audience leanings, journalists express deep concerns over political sorting in news consumption habits, with three-quarters of those surveyed saying it is a major problem when people with the same political views get their news from the same news organizations. The American public, however, appears much less worried: Roughly four-in-ten U.S. adults (39%) say this a major problem. To be able to make comparisons between journalists’ views and those of the public on certain key issues, the Center conducted two separate surveys around the same time as the journalist survey, posing some of the same questions to roughly 10,000 U.S. adults who are part of the Center’s American Trends Panel. (Read more about those two surveys in the methodology section.)
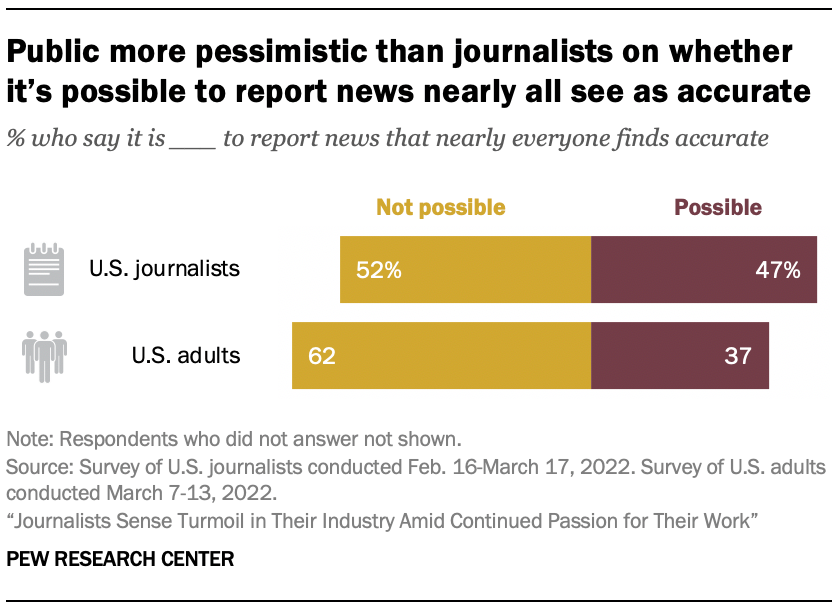
Maintaining widespread journalistic credibility in a polarized climate can seem like an impossible task – and many journalists seem to recognize that. While three-quarters of journalists say that journalists largely agree on the basic facts of the news – even if they report on them in different ways – about half of journalists surveyed (52%) say it is not possible to report news that “nearly everyone finds accurate.” An even greater share of the U.S. public overall (62%) says it is not possible to report news that is universally accepted as accurate.
Journalists and the public far apart on their assessment of today’s news industry
The survey’s results show that journalists recognize that the public views them and their work with deep skepticism. When asked what one word they think the public would use to describe the news industry these days, journalists overwhelmingly give negative responses, with many predicting that the public would describe the news media as “inaccurate,” “untrustworthy,” “biased” or “partisan.” (Read the methodology for more detail.)
Moreover, just 14% of journalists surveyed say they think the U.S. public has a great deal or fair amount of trust in the information it gets from news organizations these days. Most believe that Americans as a whole have some trust (44%) or little to no trust (42%).
When a similar question was posed to the general public, 29% of U.S. adults say they have at least a fair amount of trust in the information they get from news outlets, while 27% say they have some trust and 44% have little to none.
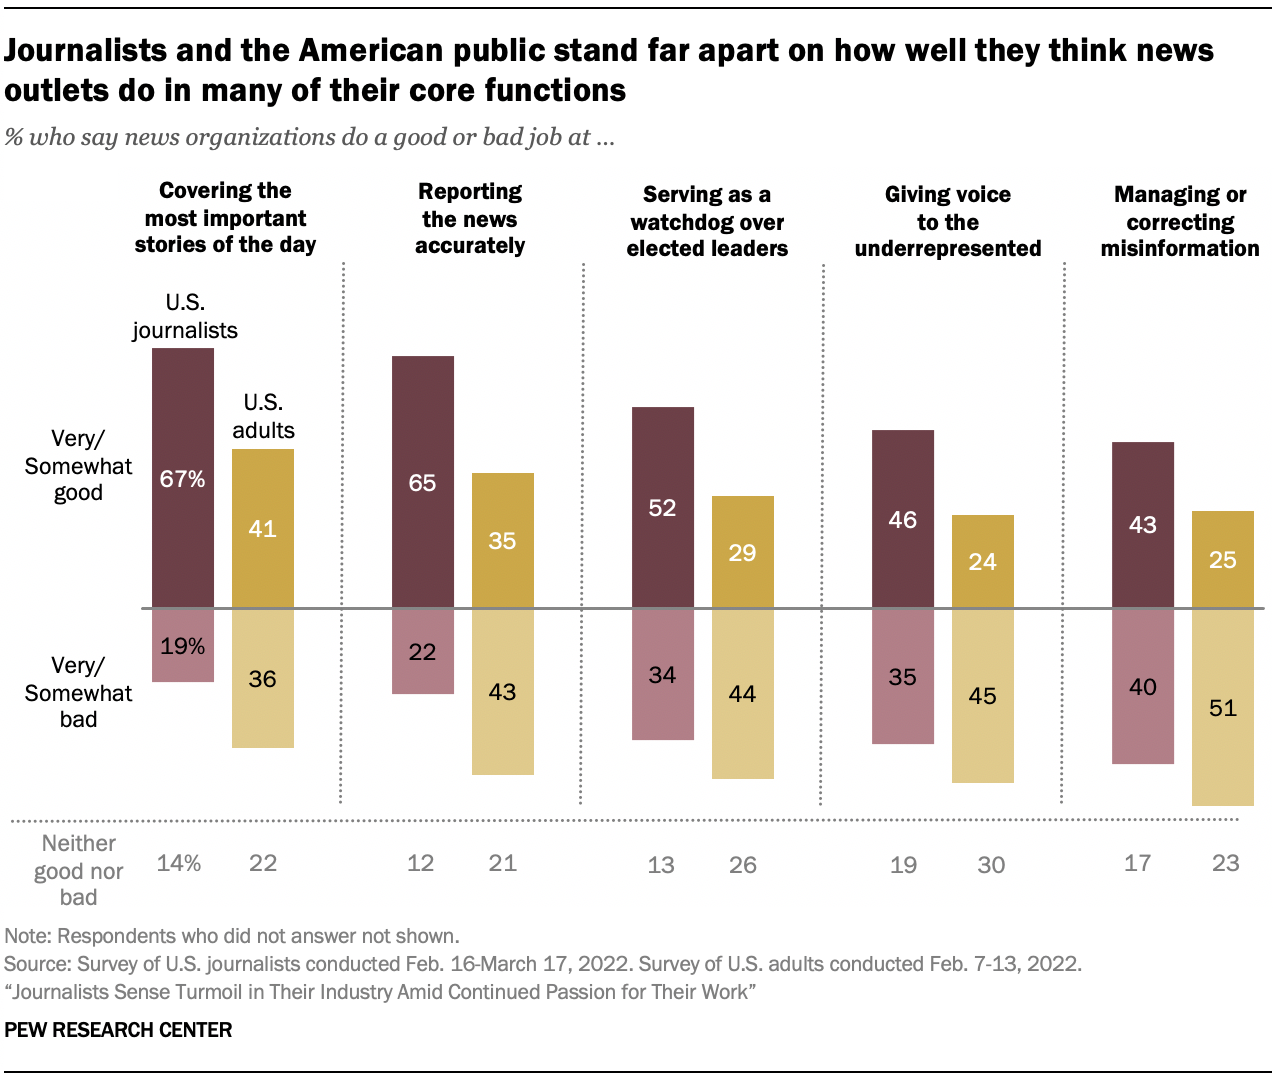
This disconnect between journalists and the public also comes through when each group is asked about the job news organizations are doing with five core functions of journalism: covering the most important stories of the day, reporting the news accurately, serving as a watchdog over elected leaders, giving voice to the underrepresented, and managing or correcting misinformation.
In all five areas, journalists give far more positive assessments than the general public of the work news organizations are doing. And on four of the five items, Americans on the whole are significantly more likely to say the news media is doing a bad job than a good job. For example, while 65% of journalists say news organizations do a very or somewhat good job reporting the news accurately, 35% of the public agrees, while 43% of U.S. adults say journalists do a bad job of this.
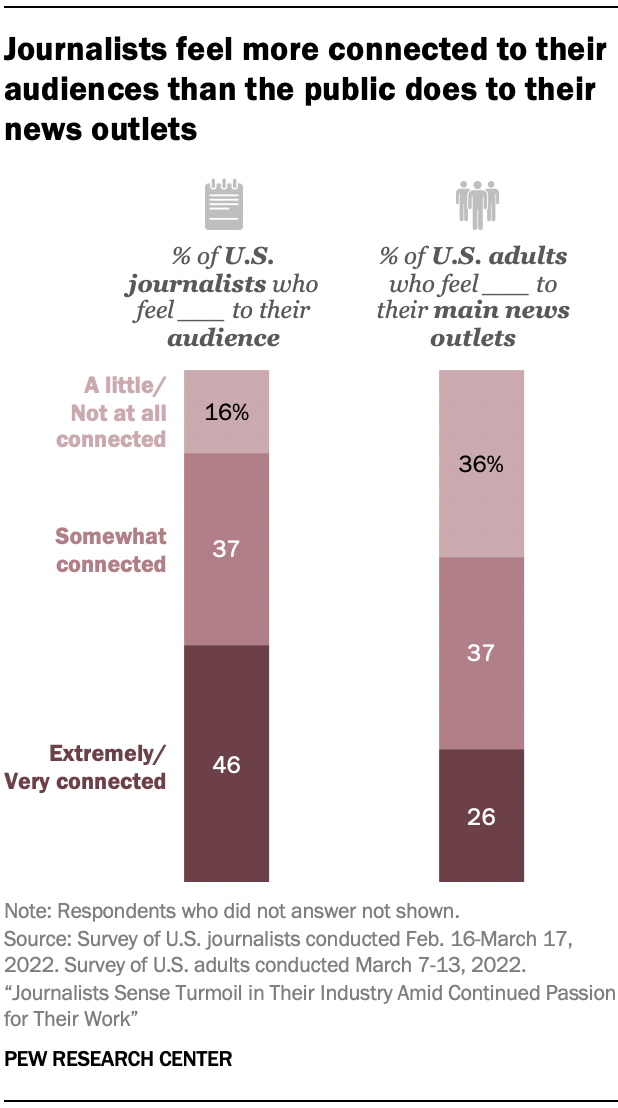
Similarly, while nearly half of journalists (46%) say they feel extremely or very connected with their audiences, only about a quarter of the public (26%) feels that connection with their main news organizations.
Journalists see social media as both a blessing and a curse
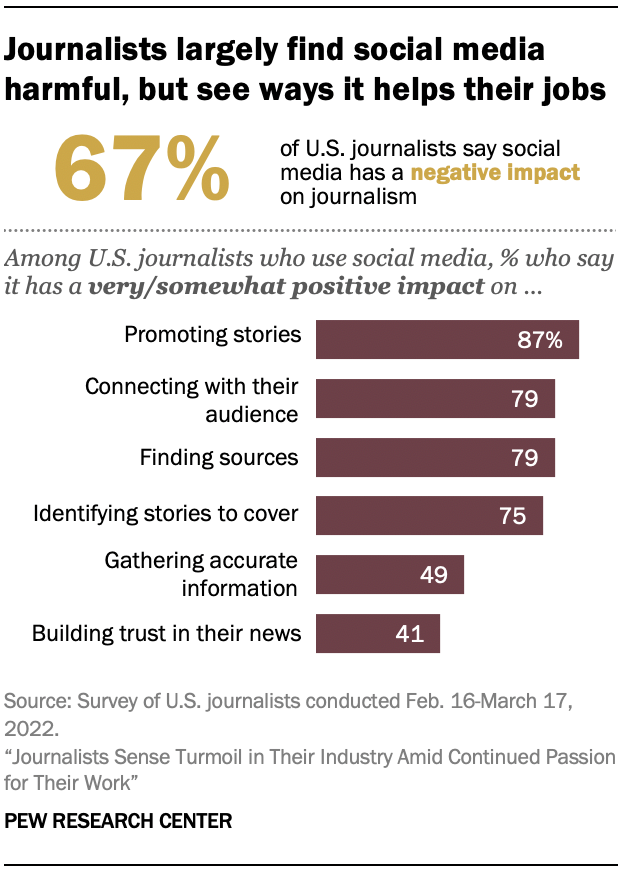
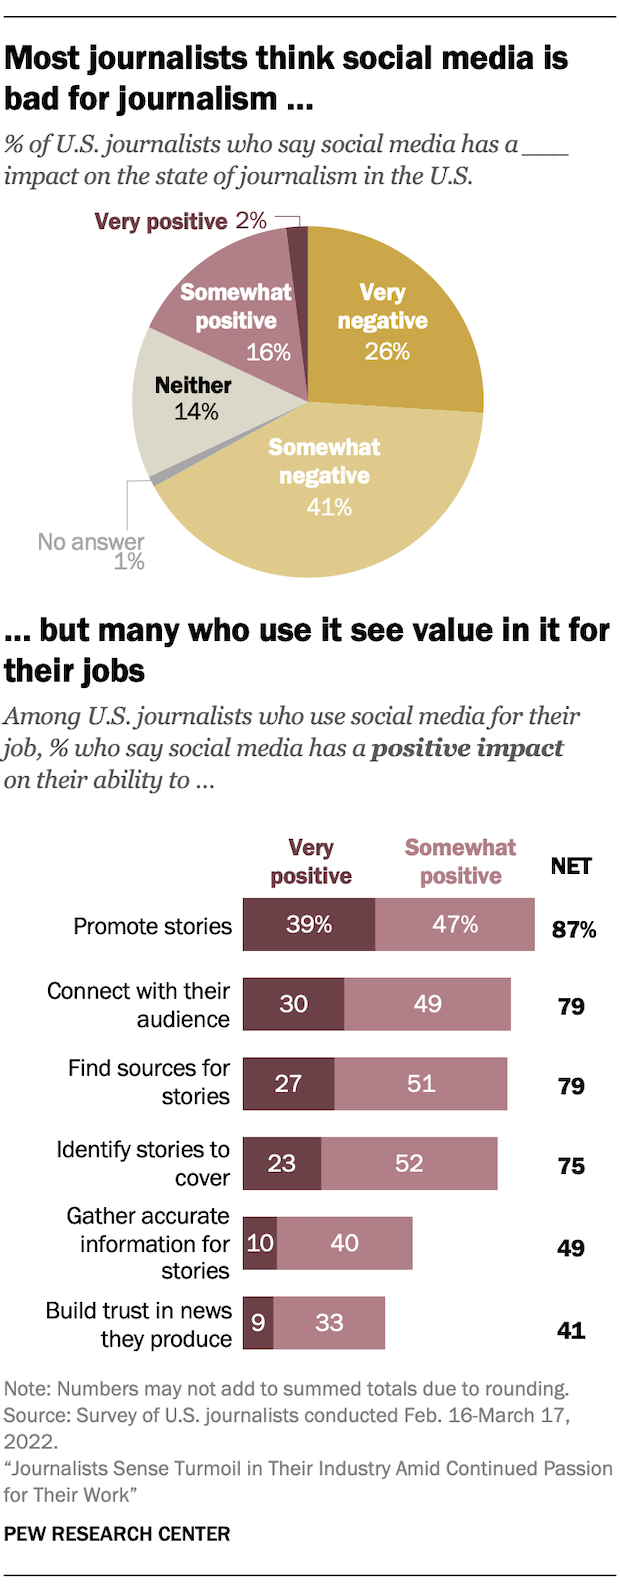
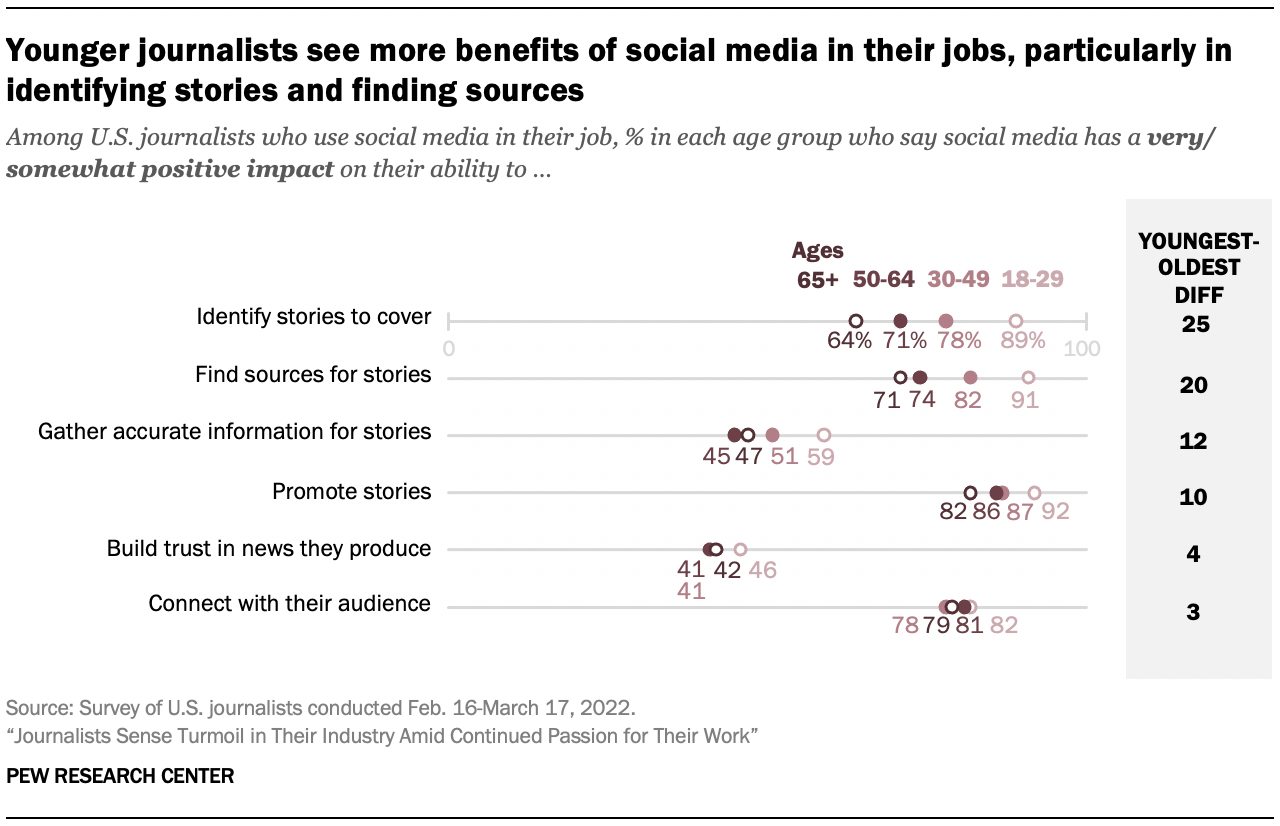
These days, many journalists connect with audiences through social media, and they see this as a double-edged sword. On the one hand, 94% of journalists surveyed report using social media in their work to some degree, and these journalists see a number of ways that social media helps them do their jobs. For example, among journalists who use social media for their work, 87% say it has a very or somewhat positive impact on promoting news stories, and 79% say it helps them connect with their audience and find sources for their news stories.
At the same time, however, two-thirds of all journalists surveyed (67%) say social media has a very or somewhat negative impact on the state of journalism as a whole. Just 18% say social media has a positive impact on the news industry, while 14% say it has neither a positive nor negative impact.
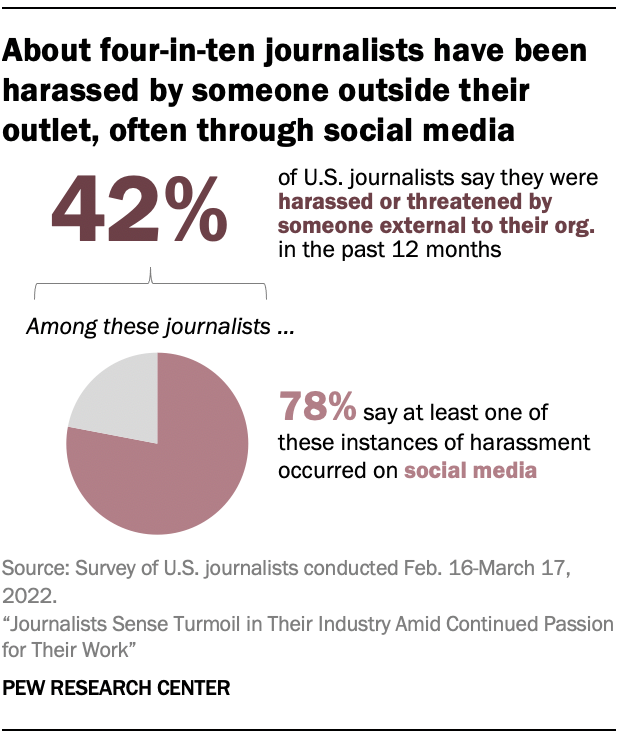
Additionally, roughly four-in-ten journalists (42%) say they have experienced job-related harassment or threats by someone outside their own organization in the past year, and within this group, a large majority (78%) say that harassment came through social media at least once. That means that one-third of all journalists surveyed report being harassed on social media in the last 12 months.
Journalists offer mixed views about diversity and inclusion in the newsroom
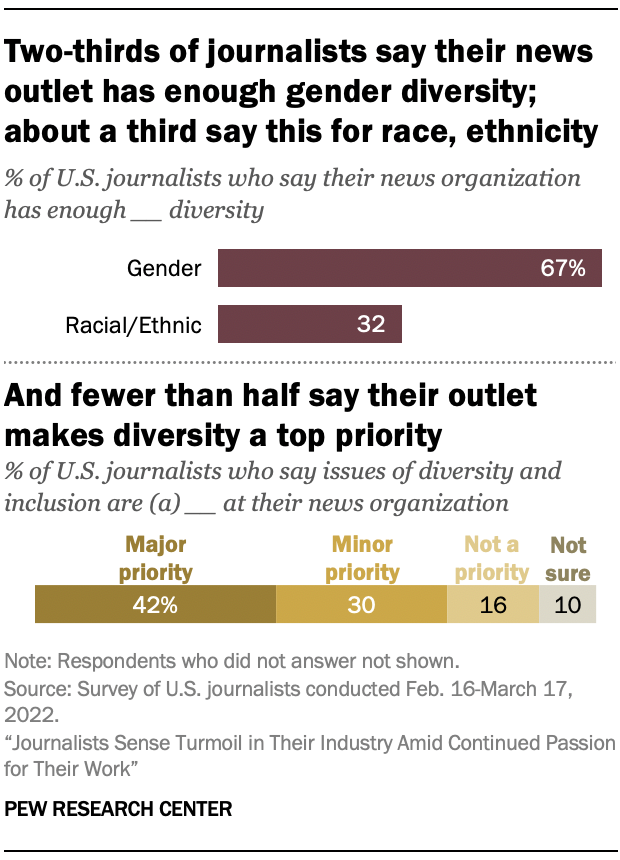
As issues of diversity and inclusion in the workspace gain heightened attention around the country, journalists offer mixed views of how their organizations are doing at diversifying staff. Although two-thirds (67%) say their organization has achieved sufficient gender diversity, about half as many – 32% – say it has reached sufficient racial and ethnic diversity. And fewer than half of respondents (42%) characterize addressing issues around diversity and inclusion as a major priority for their newsroom.
Roughly two-thirds of journalists say their organization generally treats everyone fairly regardless of age, gender, or race and ethnicity. But these figures are not quite as high among certain groups. For example, Black, Hispanic and Asian journalists are less likely than White journalists to say that their organization treats everyone fairly based on race and ethnicity. Read Chapter 6 for more details. (The appendix provides a detailed demographic profile of the journalists who completed the survey.)
Younger journalists give lowest grades on newsroom diversity, older journalists more worried about the future of press freedom
In a number of areas, there is a large amount of agreement across different groups of journalists. Still, some differences do emerge – particularly by age.
The youngest journalists (ages 18 to 29) are least likely to say their organization has enough diversity in the newsroom in a number of areas. For instance, nearly seven-in-ten (68%) say there is not enough racial and ethnic diversity, compared with 37% of journalists ages 65 and older who say the same. Younger journalists also engage with this issue more: About half of journalists under 50 say they discuss their organization’s diversity with colleagues at least several times a month, far higher than the 30% of those 65 and older who say this.
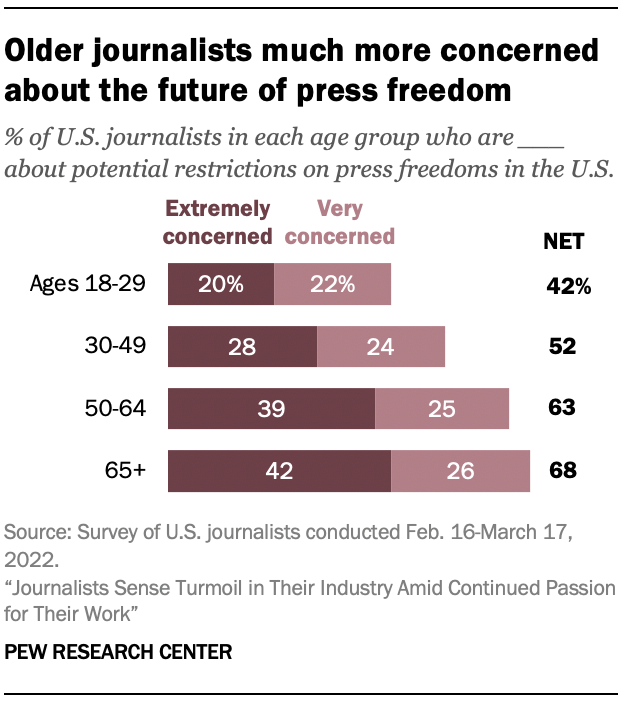
The oldest group of journalists, meanwhile, tend to feel more fulfilled by their job. Three-quarters of journalists 65 and older say their job has a very or somewhat positive impact on their emotional well-being, substantially higher than the 29% of journalists under 30 who say the same. Older journalists, meanwhile, are more worried about the future of press freedom – 68% say they are extremely or very concerned about possible restrictions on press freedom in the country, compared with 42% of those ages 18 to 29. (Read Chapter 7 for more details.)
Other key findings from the survey include:
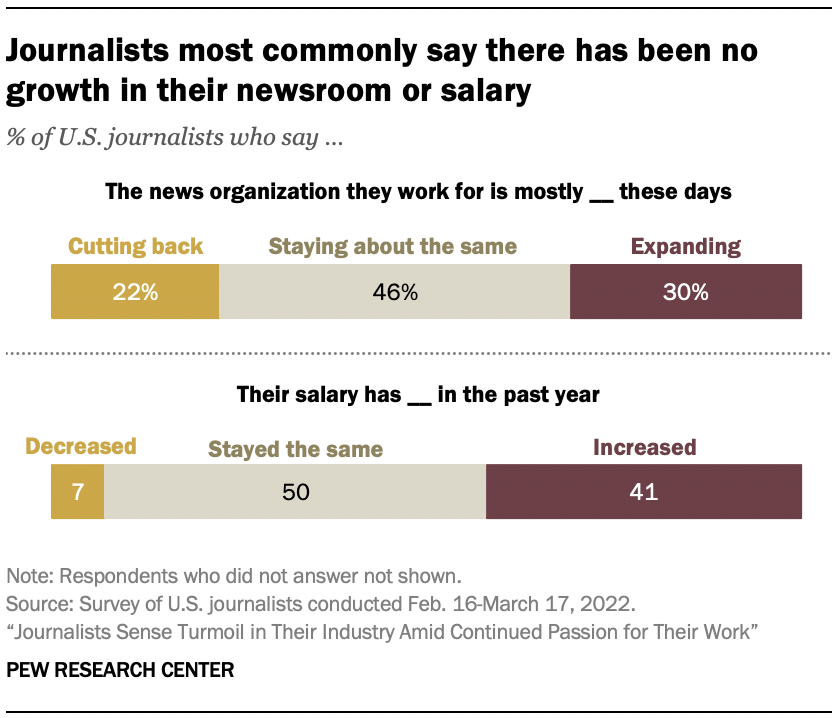
The survey sought to gauge the financial standing of journalists and the economics of the organizations they work for. The findings could be read with optimism or concern – depending on one’s vantage point. About four-in-ten journalists surveyed (41%) say they received a salary increase in the past year. The greatest portion – 50% – say their salary has stayed the same, while far fewer (7%) experienced a pay cut. Looking at news organizations more broadly, journalists are somewhat more likely to say their news organization has been expanding (30%) in the past year than to say it’s been cutting back (22%), with absence of change again being most common (46%). All in all, many journalists – 42% – say they are at least somewhat concerned about their job security, though far fewer express the highest level of concern.
Despite concerns about the spread of misinformation and reporters inserting their own views into stories, about three-quarters of journalists (74%) say that people should be allowed to practice journalism without needing a license, while one-quarter say people should be required to have a license should in order to practice journalism.
The vast majority of journalists surveyed say that at least some of the stories they have worked on in the past year had to do with the COVID-19 pandemic. But perhaps even more striking, six-in-ten say that the pandemic has brought either a great deal (26%) or a fair amount (34%) of permanent change to news reporting at their organization.
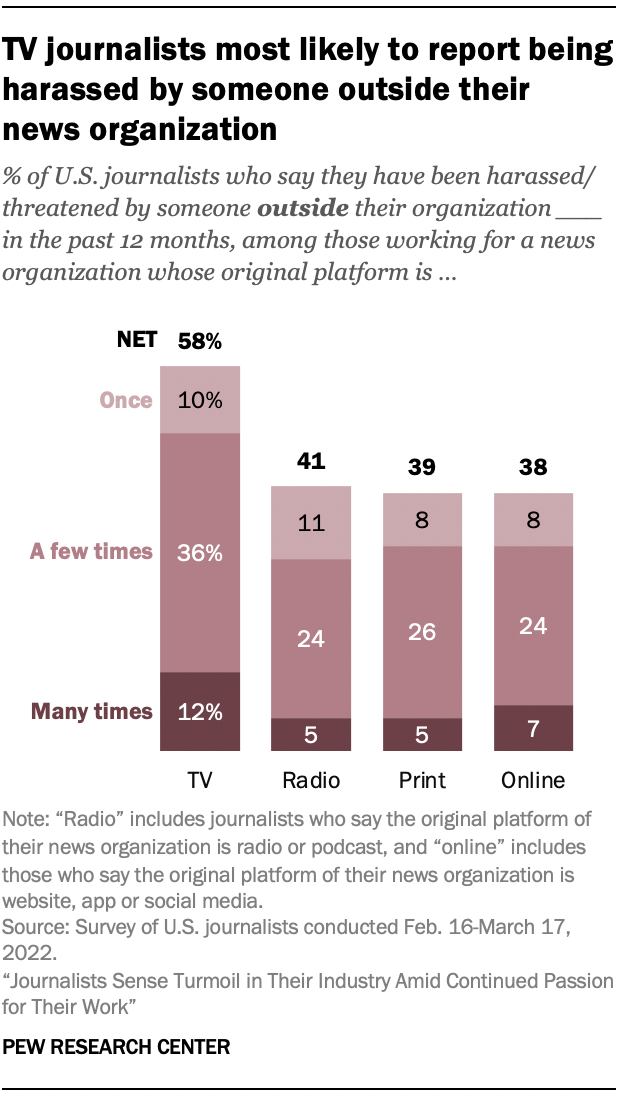
Journalists’ opinions also sometimes differ based on the platform of their organization – particularly journalists who work in television. Compared with those in print, audio or online journalism, journalists who work for an organization that originated on TV seem the least happy with their job. About one-third (34%) say the news industry has a very or somewhat positive impact on their emotional well-being, considerably lower than the 54% of those who work online, 52% who work in print and 48% who work in radio or podcasting who say the same. And TV journalists are much more likely to say they were harassed by someone outside their organization in the past year (58%).
1. Journalists express high job satisfaction but are concerned about the state of the news industry
BY JEFFREY GOTTFRIED, AMY MITCHELL, MARK JURKOWITZ AND JACOB LIEDKE
Despite years of cutbacks, layoffs and buyouts across many parts of the news industry – as well as disinformation campaigns and the stresses of the COVID-19 pandemic – U.S. journalists in 2022 express a great deal of personal satisfaction in their jobs.
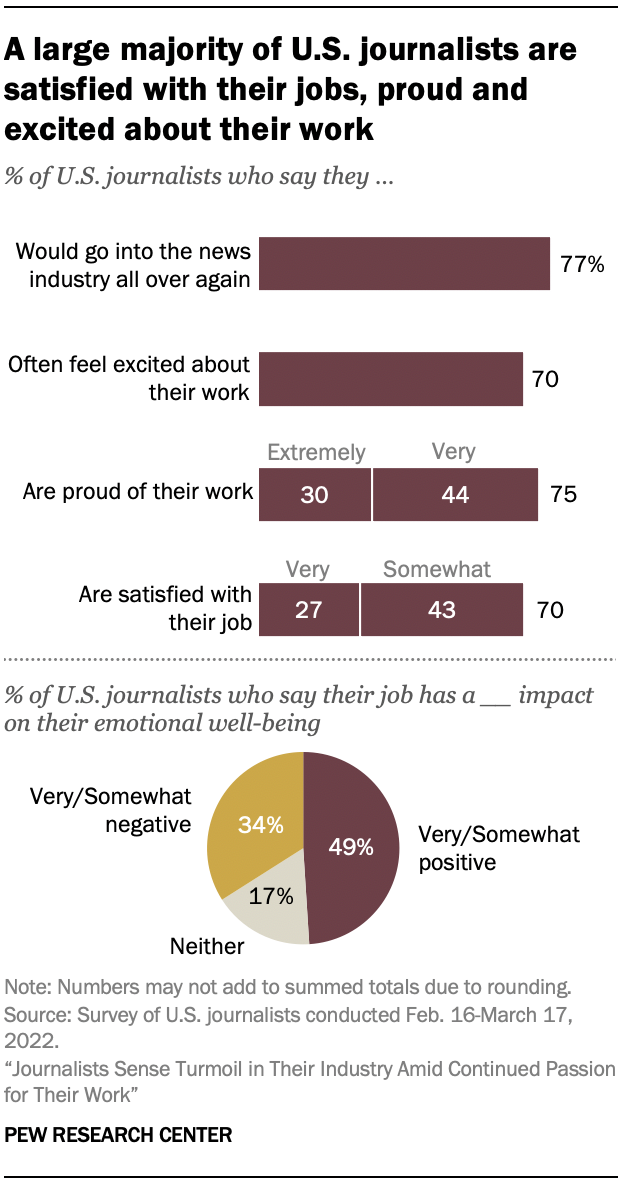
Seven-in-ten journalists surveyed say they are very (27%) or somewhat (43%) satisfied with their job these days. That far outpaces the 22% who say they are very or somewhat dissatisfied; the remaining 8% are neither satisfied nor dissatisfied. Seven-in-ten journalists also say they often feel excited about their work, compared with 29% who say they often feel discouraged about it.
Along these same lines, three-quarters of journalists say they are extremely (30%) or very (44%) proud of the work they do. Roughly one-in-five (21%) are somewhat proud, while only 5% express little or no pride in their work. What’s more, nearly eight-in-ten (77%) say that if they could go back in time, they would pursue a career in the news industry all over again.
The effects of the job on journalists’ emotional well-being are more mixed. About half of journalists (49%) say their job has a positive overall impact on their emotional well-being – either very positive (16%) or somewhat positive (33%) – but about a third (34%) say their work is having a very or somewhat negative impact. A smaller share (17%) say the impact is neither positive nor negative.
‘Struggling’ and ‘chaotic’ are the words journalists most often use to describe their industry
Despite mostly positive assessments of their jobs, journalists recognize the instability and turmoil in the news industry more broadly.
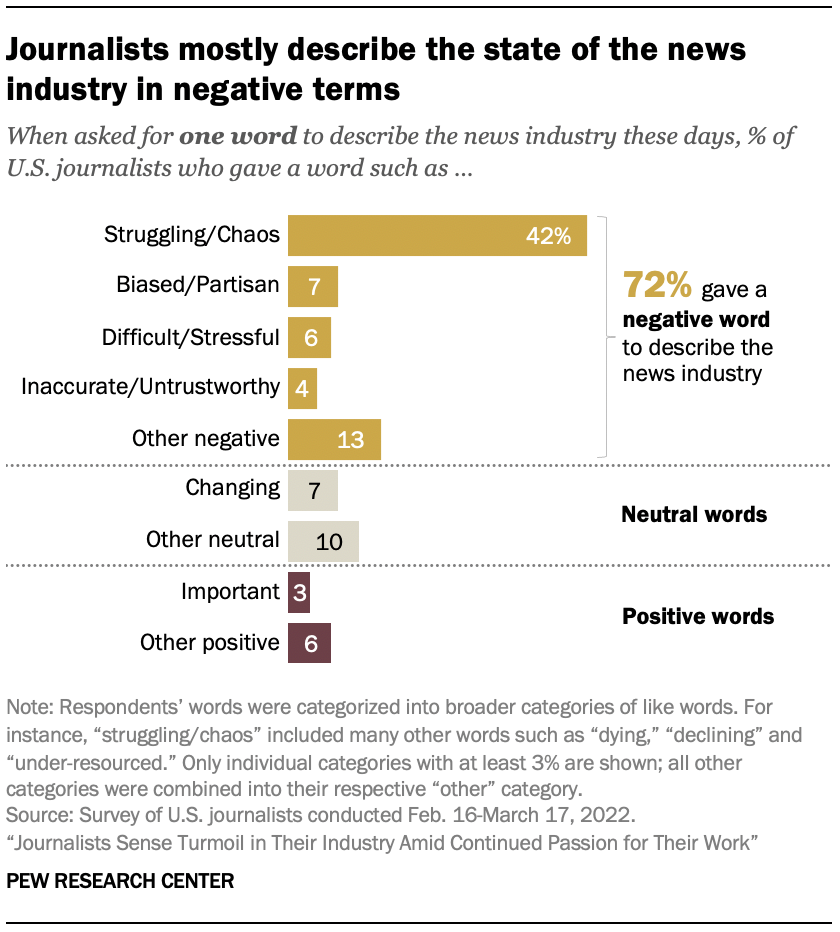
When asked to provide the one word they would use to describe the current state of their industry, journalists’ answers largely point to challenges.1 The concept offered far more often than any other is that of chaos and struggle: 42% mentioned words such as “chaotic,” “dying,” “declining” or “struggling.”
Overall, about seven-in-ten respondents (72%) offered negative words, including some who used words like “biased” or “partisan” (7%) and others who gave a word such as “stressful” or “difficult” (6%). Just 9% of responses carried a positive tone, including words such as “important.” Another 17% were neutral in nature, including terms like “changing,” “fast,” “busy” or “competitive.”
Journalists also were asked for one word they think the public would use to describe the news industry; the results, which include an even higher share of negative words, are in Chapter 4.
Journalists say the industry’s best function is getting the news out, but many say it fails at getting the story right
Journalists were asked in a pair of open-ended questions to write down what the news industry does the best job of these days, and what it does worst.2 Overall, the responses indicate that journalists think the profession is good at getting the news out and adapting to changes in the industry. But getting the story right and issues related to bias and partisanship rise to the top as areas journalists think the industry handles worst.
Nearly a quarter of journalists surveyed (23%) say that the one thing the news industry does best is getting the news out – higher than any other category. “Getting the news out” includes a range of responses, from covering news quickly and covering breaking news to the quantity and variety of content available.
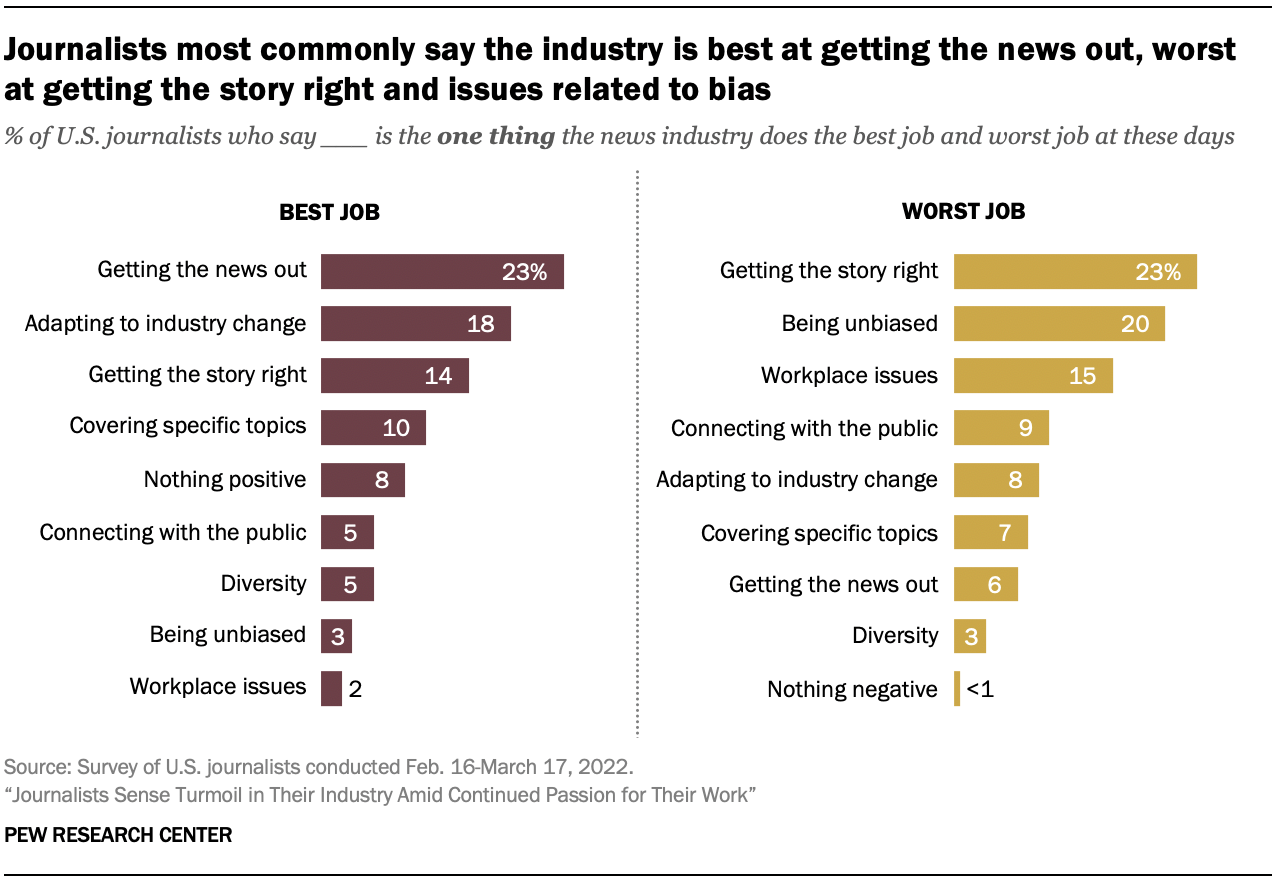
Also near the top of the list of things journalists say their industry does best is adapting to changes – an answer provided by 18% of respondents. This includes adapting to technological changes in the workplace, shifting business models and a generally evolving media environment.
Two other areas were named by at least 10% of journalists as the industry’s greatest strength – getting the story right (e.g., truth and accuracy, handling misinformation, and investigative reporting, named by 14% of respondents) and coverage of specific topic areas (10%).
While “getting the story right” is named by 14% of journalists as the thing the industry does best, nearly a quarter (23%) identify it as the thing the profession does worst – rising to the top in that category.
Other negative responses illuminate journalists’ significant concerns about how the industry handles issues related to bias and partisanship, including objectivity in coverage and ensuring that diverse viewpoints are represented in stories. One-in-five journalists surveyed say that is what the industry is worst at. Meanwhile, 15% say the industry’s weakest point relates to internal workplace issues, such as salaries, labor practices and staffing issues.
There is no consensus on whether journalism in general is doing a good job at issues of diversity in the workplace and reporting, with 5% putting this in the “best” category and 3% citing it as something the industry does worst.
Perhaps reflecting the generally negative feelings that journalists have toward the news industry these days, 8% of journalists surveyed say there is nothing that the news industry does the best, while virtually all respondents came up with something the industry does the worst.
Mixed reports of salaries and newsroom growth in the past year
The survey asked a few questions aimed at getting a sense of the financial standing of journalists and the economics of the organizations they work for. On the one hand, the responses may seem surprisingly positive in the context of an industry that has been experiencing cutbacks for many years. On the other hand, for the majority of journalists and their companies, stagnation or contraction appears to be the norm. And many express at least some concern about their job security.
About four-in-ten journalists surveyed (41%) say their salary increased in the past year. But the greatest portion (50%) say their salary has stayed the same, and 7% say they experienced a pay cut.3
Similarly, looking at news organizations more broadly, three-in-ten journalists say their news organization – or the main one they work for if they work for more than one – is mostly expanding, greater than the share who say their organization is mostly cutting back (22%). The plurality (46%) say it is staying about the same size.
While we could not identify any benchmarks for these questions among journalists, previous Center research shows that newsroom employment overall has dropped in recent years, particularly among newspapers, though there have been considerable gains among digital-native outlets. This is in line with findings in Chapter 8 showing that journalists who say they work for outlets that originally started online are more likely than those who work for other types of outlets to say their outlets are expanding.
Additionally, the beginning of the COVID-19 pandemic proved to be very difficult for the revenues of many news organizations, especially newspaper companies – many of which received a Paycheck Protection Program loan from the U.S. government.
All in all, about four-in-ten journalists (42%) are at least somewhat concerned about their job security, though fewer express high levels of concern – 16% say they are extremely or very concerned. Most (57%) are “a little concerned” or “not at all concerned” about their job security.
Most journalists are not in a union, but many say they would join
The past few years have seen a surge in newsroom staff seeking to unionize, and in many cases, succeeding. There have been more than 100 newsroom unionizations since 2015 and 37 in 2020 alone.
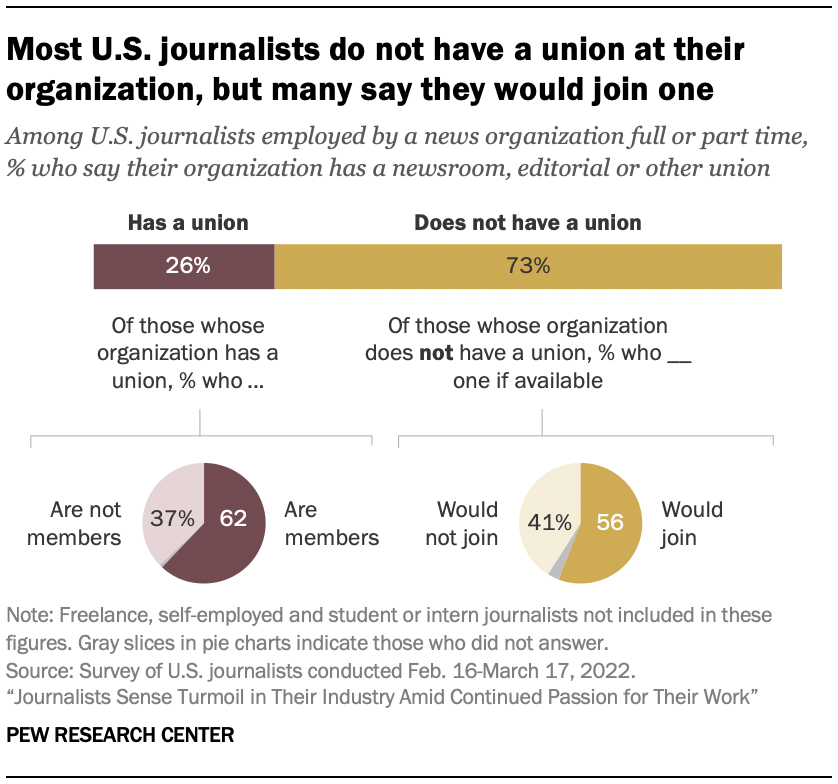
In this survey, about a quarter of journalists who are employees of a news organization either full time or part time (26%) say their organization has a union, and among those who have one, roughly six-in-ten (62%) say they are a part of it.4 That amounts to 16% of all journalists employed full or part time at news organizations who say they are members of a union.
Among those without a union, most (56%) say they would join one if it were available.
About one-in-ten journalists have experienced harassment inside their organization, most often along political lines
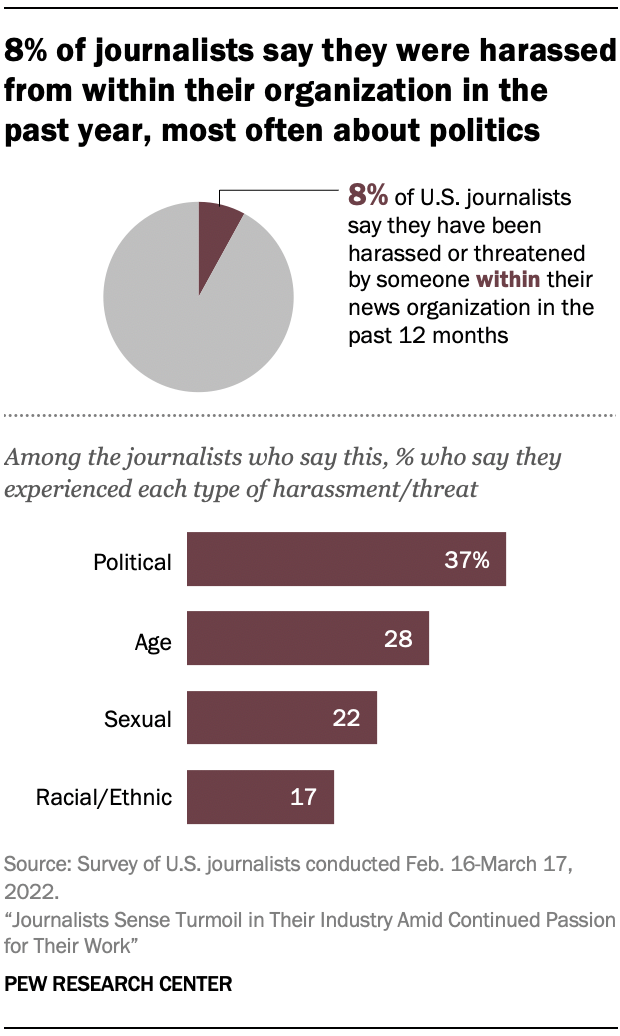
Overall, 8% of journalists surveyed say they have experienced threats or harassment from someone inside their organization at least once in the past year, including 5% who say it has happened more than once. Additionally, 11% of journalists characterize harassment or threats from people within their own organization as a major (2%) or minor problem (9%), although a large majority (86%) say this is not a problem at their organization.
Among those who say they have experienced harassment from inside their organization, the largest share (37%) say the harassment was political in nature. That compares with 28% who say they experienced age-related harassment, 22% who mention sexual harassment and 17% who say they faced racial or ethnic harassment. (The appendix provides a detailed demographic breakdown of the sample of journalists who completed the survey.)
Journalists largely say COVID-19 has changed their organizations forever
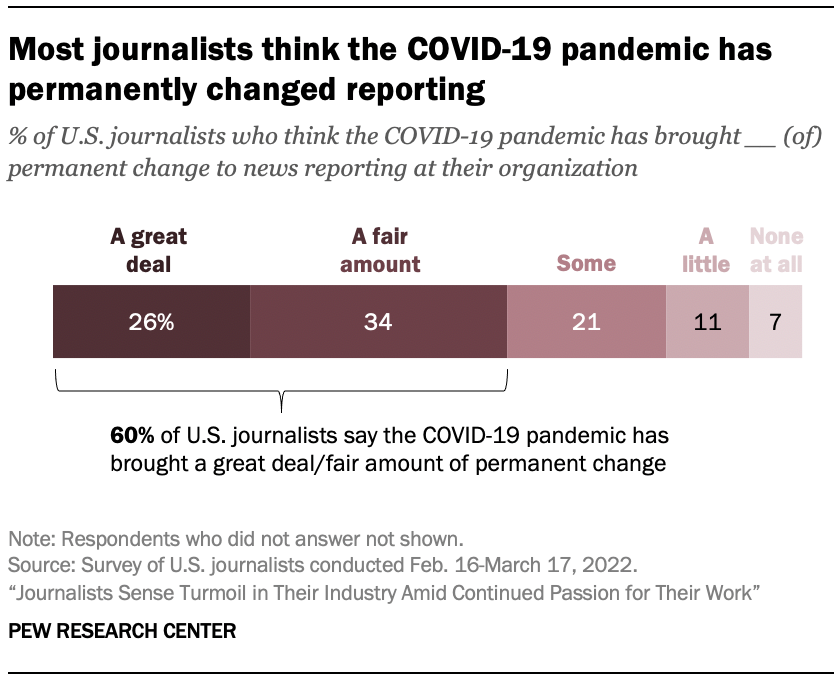
Journalists largely agree that these past two years of altered life due to the COVID-19 pandemic will have a lasting impact. Six-in-ten journalists surveyed say the pandemic has brought a great deal or fair amount of permanent change to news reporting at their organization. Another 21% say it has brought some change.
Additionally, a vast majority of journalists have worked on stories that had to do with the COVID-19 pandemic. Four-in-ten journalists say that at least half of the stories they have worked on in the past 12 months had to do with COVID-19 in some way, with another 44% saying that some but less than half of their stories had to do with it. Just 15% said almost none had to do with COVID-19.
2. Journalists highly concerned about misinformation, future of press freedoms
BY JEFFREY GOTTFRIED, AMY MITCHELL, MARK JURKOWITZ AND JACOB LIEDKE
Amid efforts to fight false and made-up information, anti-media campaigns, increased lawsuits and global news crackdowns, journalists in the United States express great concern about the future of press freedoms.
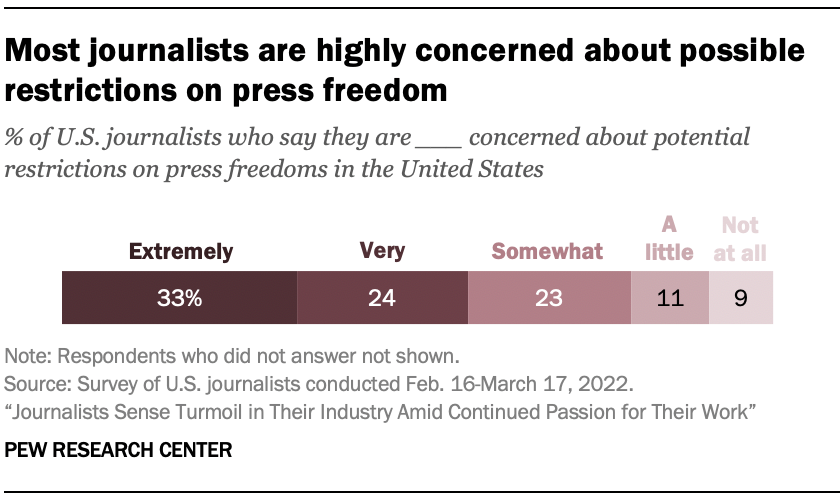
Roughly six-in-ten journalists surveyed say they are either extremely (33%) or very concerned (24%) about potential restrictions on press freedoms in the U.S. About a quarter (23%) are somewhat concerned, while just one-in-five express low levels of concern about this.
Journalists see false and made-up news as a big problem and don’t have much confidence in how the industry handles it
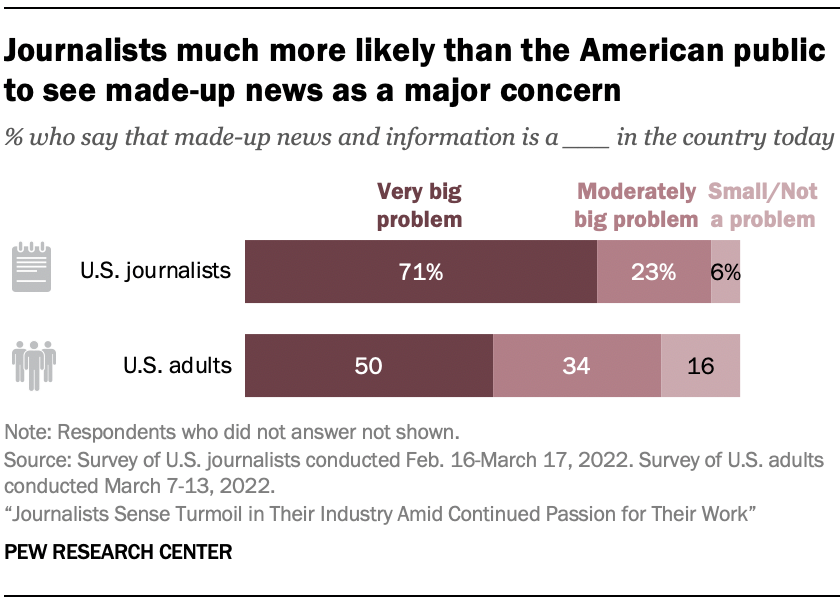
Another area of concern for journalists is the volume of erroneous information today. More than nine-in-ten journalists surveyed (94%) say made-up news and information is a significant problem in America today, with 71% identifying it as a very big problem and 23% seeing it as a moderately big problem; 6% say it is a small problem or not a problem at all.
The American public also sees made-up news and information as a problem, but not quite to the same extent. In a separate survey of 10,441 U.S. adults conducted March 7-13, 2022, 50% say made-up news is a very big problem (21 percentage points below journalists), while another 34% say it is a moderately big problem and 16% say it is a small problem or not a problem at all.
Misinformation is a fairly regular topic of conversation within the newsroom itself. About six-in-ten journalists (58%) say they had conversations with colleagues about misinformation at least several times a month over the past year.
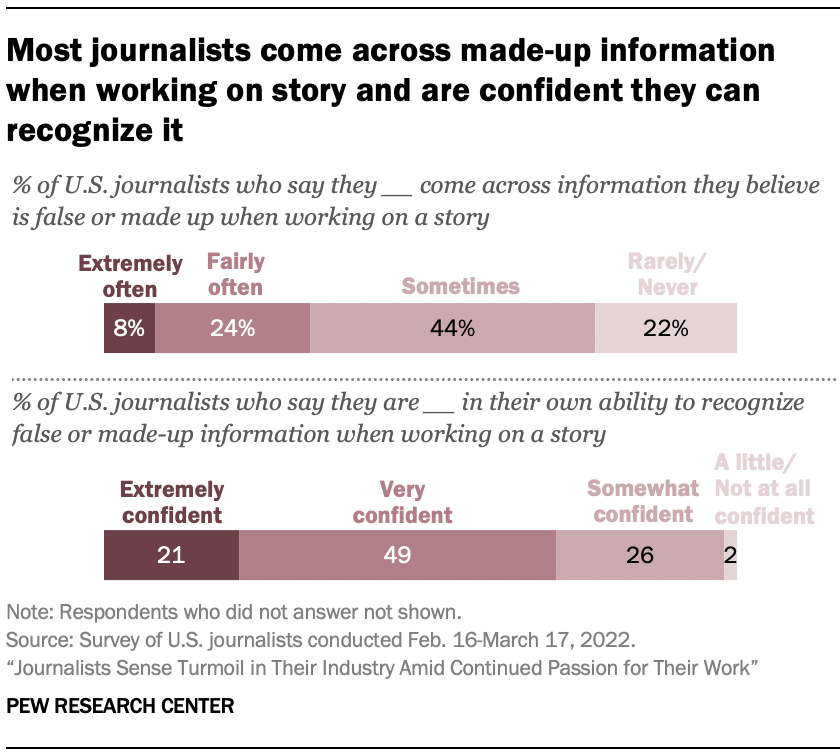
The survey also finds that one-third of journalists indicate that they deal with false or made-up news in their work on a fairly regular basis – saying that they come across false information when working on a story either extremely often (8%) or fairly often (24%). Another 44% say they sometimes come across it.
About seven-in-ten journalists (71%) say they are either extremely (21%) or very confident (49%) in their ability to recognize false information when they are working on a story.
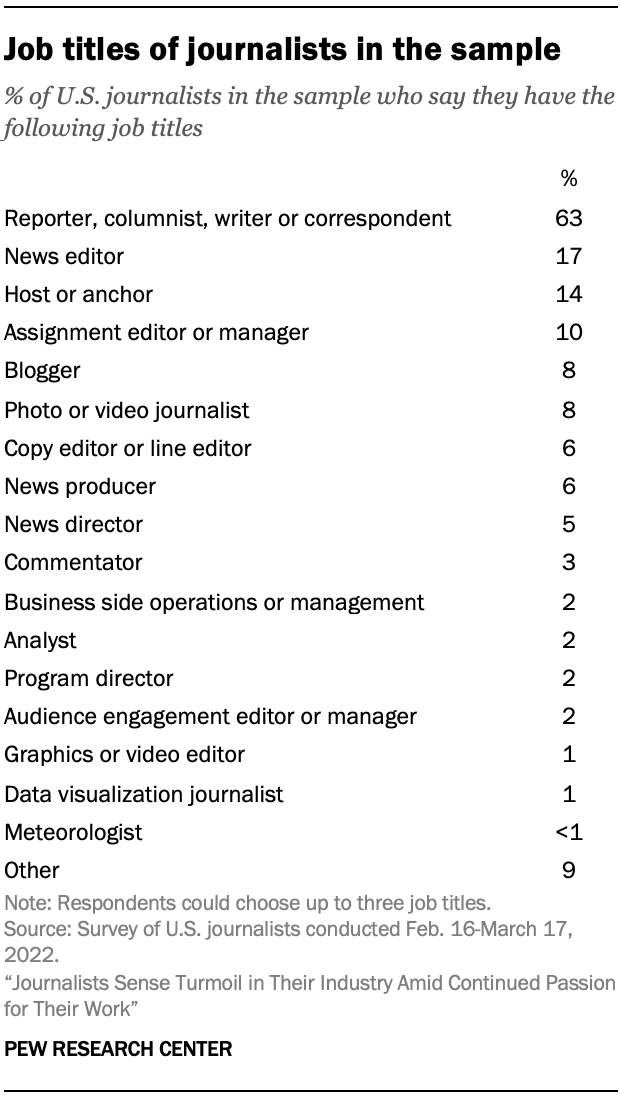
Still, specifically among reporting journalists, about a quarter (26%) say they unknowingly reported on a story that was later found to contain false information. (Reporting journalists are those who indicated in the survey that they report, edit or create original news stories and that they have one of the following job titles: reporter, columnist, writer, correspondent, photojournalist, video journalist, data visualization journalist, host, anchor, commentator or blogger. About three-quarters of all journalists in this study – 76% – are reporting journalists.)
While the journalists surveyed here may feel good about their own ability to detect misinformation, they are not particularly confident in the industry’s ability to manage or correct it. Only 8% of all journalists surveyed say news organizations do a very good job at handling misinformation, while another 35% say news outlets are somewhat good at it – lower than the ratings journalists give news organizations on several other core functions (see Chapter 4).
And most say their news organization (or the main one they work for if they work for more than one) does not have formal guidance on how to handle made-up and false information in their jobs. Six-in-ten say their organization does not have guidelines for how to handle false and made-up information that they come across, far higher than the 36% who say their organization does.
Most journalists think it is important to report on the false statements of public figures
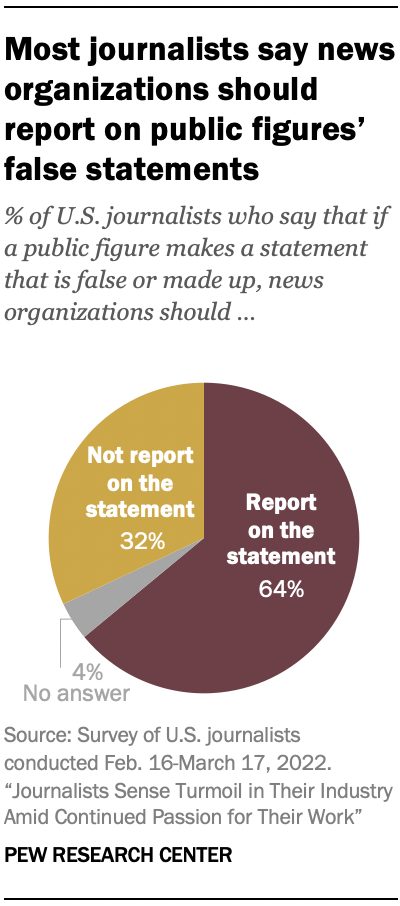
Most journalists think that part of managing misinformation means reporting on public figures who make false or made-up statements. Twice as many journalists say that if a public figure makes a statement that is false or made up, news organizations should “report on the statement because it is important for the public to know about” (64%) rather than “not report on the statement because it gives attention to the falsehoods and the public figure” (32%).
Many journalists, though, never or almost never cover the issue of misinformation. Two-thirds of journalists surveyed (66%) say almost none of the stories they worked on in the past year had to do with false or made-up information. Just 6% of those surveyed say half or more of the news stories they worked on covered false or made-up news in some way, while about a quarter (27%) say that some of their stories – but fewer than half – dealt with this topic.
Vast majority of journalists are against requiring a license to be a journalist
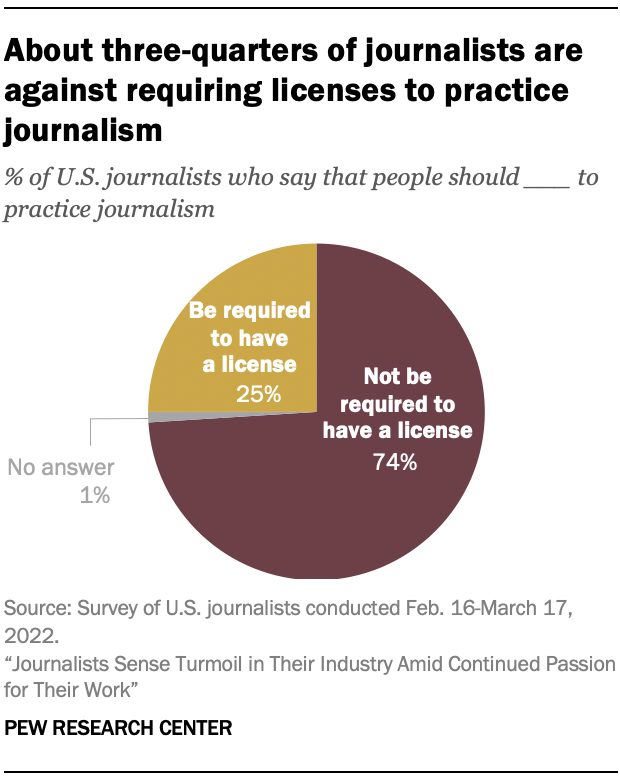
One particular feature of journalism is that there is no requirement to have a license or certification process to call oneself a journalist – unlike a physician would in order to practice medicine in the United States. The question of whether to require one or not occasionally gets raised. As of now, a solid majority of journalists are against such a requirement. Nearly three-quarters of journalists (74%) are in favor of continuing to allow journalists to practice journalism without needing a license. One-quarter of U.S. journalists would like to see a license required for members of their industry. (Chapter 8 looks at how these views vary by the original platform of the organization that journalists work for.)
Currently, there is no licensing requirement for journalists themselves. Radio and television stations are licensed and regulated by the Federal Communications Commission, but there is no such regulatory authority for newspapers and online outlets.
3. Many journalists say social media helps at work, but most decry its impact on journalism
BY JEFFREY GOTTFRIED, AMY MITCHELL, MARK JURKOWITZ AND JACOB LIEDKE
The vast majority of U.S.-based journalists today use social media sites in their work. But even as they appreciate the ways it can be helpful with several reporting tasks, most journalists think social media is having a negative impact on journalism as a whole – and one-third report being harassed on these platforms by someone outside their organization.
Two-thirds of journalists surveyed (67%) say social media has a very (26%) or somewhat negative (41%) impact on the state of journalism in this country. Conversely, only about one-in-five (18%) characterize it as having a positive impact, including just 2% who say it is very positive.
Still, the vast majority use social media for their work. The survey asked about 11 social media sites, finding that fully 94% of journalists use at least one of them professionally – most often Twitter and Facebook. Overall, 69% of journalists say Twitter is their first or second most used social media site, while about half (52%) put Facebook in their top two. Smaller shares say Instagram (19%), LinkedIn (17%) or YouTube (14%) – among other sites asked about – has such prominence in their social media diet.
Journalists recognize several ways social media can come in handy in their day-to-day work. Among journalists who use social media for their jobs, nearly nine-in-ten (87%) say it has a very or somewhat positive impact on their ability to promote stories, while about eight-in-ten say it helps their ability to connect with their audience and find sources for stories (79% each). Three-quarters of journalists who use social media find it helpful in identifying stories that should be covered.
In a few critical areas, however, social media is viewed as less of an asset. About half of journalists who use social media for their work (49%) say it has at least a somewhat positive impact on their ability to gather accurate information for stories, and 41% say it helps them create trust with the public. About one-in-five or fewer in each of these six areas say social media has a negative impact, while the remainder say social media has neither a positive nor a negative impact or did not answer.
Younger journalists – particularly those ages 18 to 29 – are more likely than their older colleagues (especially those 65 and older) to see social media as an asset in certain areas of their work. (Read Chapter 7 for more on differences by age.)
While social media has a big presence in newsrooms, that is not the case for artificial intelligence (AI) – at least not yet. Just 8% of journalists surveyed say their news organization (or the main one they work for if they work for more than one) relies on content generated by computer programs using AI at least a little, including only 1% who say this is the case a lot. Fully 62% say their organization does not rely on AI at all, and 29% are unsure.
Most journalists who were harassed by someone outside their organization in the past year say it happened on social media
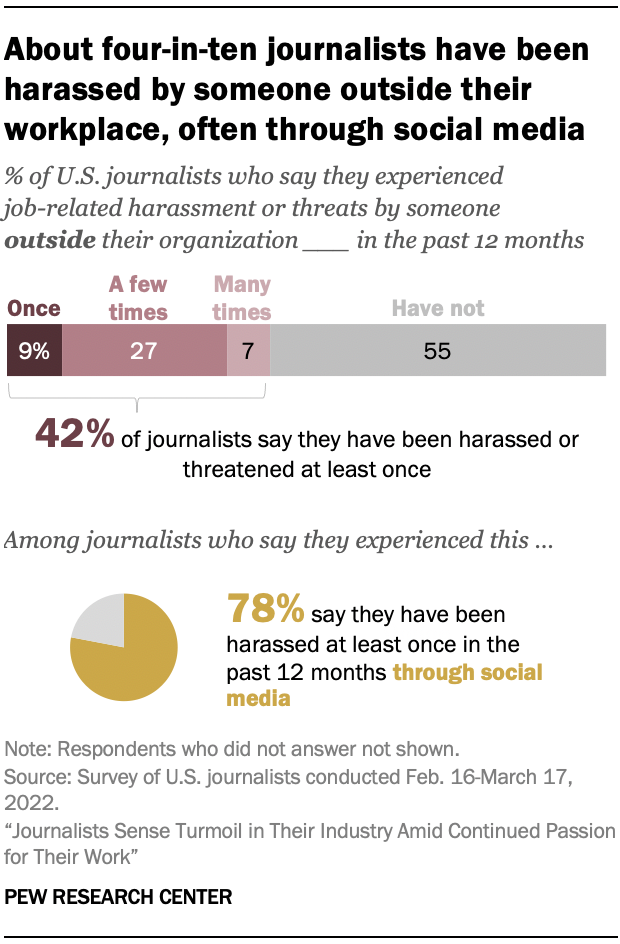
One negative impact of social media for many journalists is that it is sometimes used to harass them. About four-in-ten journalists surveyed (42%) say they experienced job-related harassment or threats by someone outside their workplace at least once in the past year, and most of these incidents occurred online – often through social media.
About three-quarters of those who experienced harassment external to their organization (76%) say it mostly occurred online, while far fewer say it mostly happened over the phone (11%), in person (8%) or through the mail (4%). And nearly eight-in-ten of those who experienced harassment from outside their organization (78%) say that it happened at least once in the past 12 months through a social media site – which amounts to one-third of all journalists surveyed.
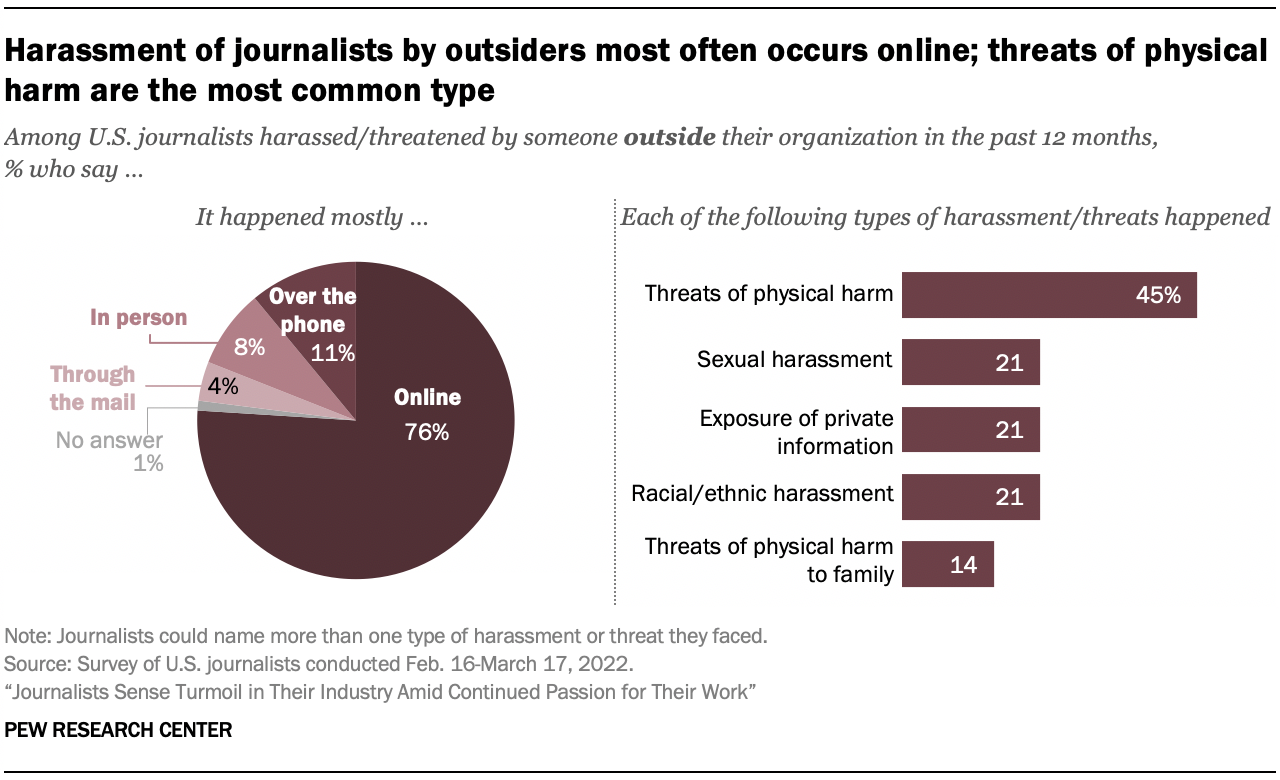
Threats of personal physical harm are the most common forms of harassment. Just under half of those who have been harassed in the past year (45%, or 19% of all journalists in the survey) say they received threats of personal physical harm. That is followed by sexual harassment, harassment based on their race or ethnicity, and threats of exposing personal information, at 21% each. (In the survey, journalists could indicate that they experienced more than one type of threat.)
At the same time, journalists do not seem overly concerned about the issue. About one-in-ten of all journalists (11%) say outside harassment and threats are a major problem at their news organization, while 43% say this is a minor problem and another 43% say it is not a problem. Roughly three-in-ten journalists (28%) say they discuss the safety of people in the industry with other colleagues at least several times a month.
Some groups of journalists are more likely than others to have experienced harassment or threats by people outside their news organization, particularly certain types of harassment. For instance, about a quarter of Black (27%) and Asian (27%) journalists say they have experienced threats or harassment based on their race or ethnicity, as do 20% of Hispanic journalists, compared with just 5% of White journalists. Black, Hispanic and Asian journalists are also more likely to say they discussed the issue of safety in the industry with colleagues at least several times a month in the past year.
About one-in-six journalists who are women (16%) say they have been sexually harassed by someone outside their organization, versus 3% of men. And journalists under 50 tend to report being harassed or threatened in several ways at higher rates than their older colleagues. (Read Chapter 7 and Chapter 8 for more detail on how different journalists experience harassment. The appendix provides a detailed demographic profile of the journalists who completed the survey.)
4. Journalists and the public differ on how journalists are doing, how connected they are
BY JEFFREY GOTTFRIED, AMY MITCHELL, MARK JURKOWITZ AND JACOB LIEDKE
Much of Pew Research Center’s past research on the state of journalism in the United States has focused on Americans’ assessments of how well journalists are doing their jobs and serving the public. In this new survey, researchers got the other side of the story – asking journalists to provide their own sense of how well they are doing and how the public receives their work.
Overall, journalists give themselves relatively high marks on performing several of the core functions of journalism. The public, however, does not see it the same way.

The survey asked about five core functions of news organizations, and journalists gave more positive than negative assessments for four of them. Around two-thirds of journalists surveyed say news organizations do a very or somewhat good job covering the most important stories of the day (67%) and reporting news accurately (65%). By comparison, roughly one-in-five journalists say news outlets do a very or somewhat bad job at these core functions, while 14% and 12%, respectively, say they do a neither good nor bad job.
About half of the journalists surveyed say news organizations do at least somewhat well at serving as watchdogs over elected leaders (52%) and giving voice to the underrepresented (46%), versus roughly a third who say they do a bad job at each of these tasks (34% and 35%, respectively). But journalists’ assessments are about as negative as they are positive when it comes to the job the news media does managing or correcting misinformation: 43% say news organizations do a very or somewhat good job at this, while 40% say they do poorly.
The American public, however, delivers a decidedly more negative assessment than journalists do for all five of the core functions. In a separate representative survey of 9,388 U.S. adults conducted Feb. 7-13, about twice as many adults say news organizations do a very or somewhat bad job at managing or correcting misinformation (51%) as say they do a good job (25%). And about a third of Americans or fewer say news organizations do at least a somewhat good job giving voice to the underrepresented (24%), serving as a watchdog over elected leaders (29%) and reporting the news accurately (35%), compared with larger shares who say journalists do a bad job in all these areas.
One core function that Americans are slightly more likely to say that news organizations do a good job than bad job is at covering the most important stories of the day – 41% say they do a good job and 36% say they do badly. That is still well below the 67% of journalists who say they do a good job of covering the most important stories.
Journalists sense that Americans don’t have high trust in the news media overall, but think their own audience trusts them
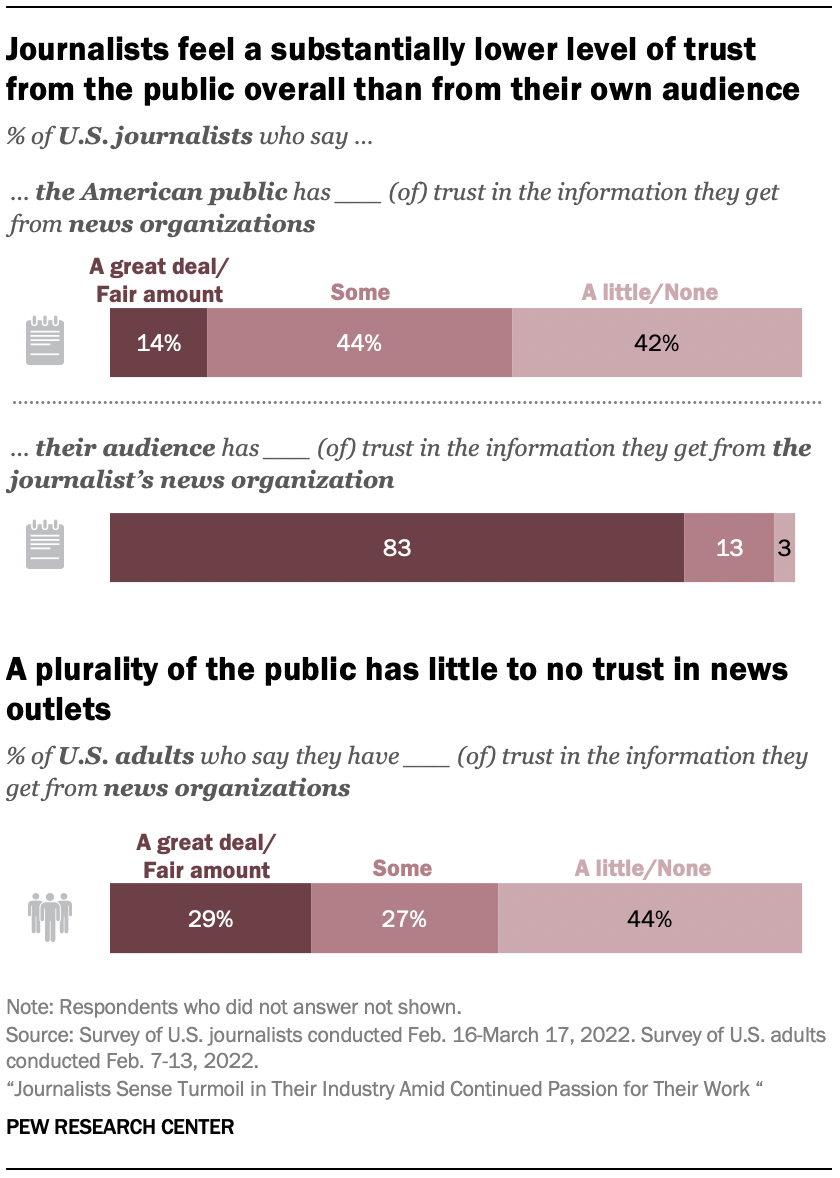
Relatively few Americans have a high level of trust in news outlets – and journalists sense that. About four-in-ten journalists (42%) say they think the public as a whole has little or no trust in the information they get from news organizations, and a similar share (44%) say they think the public has some trust. Only 14% of the journalists surveyed say they think the public generally has a great deal or even a fair amount of trust in the news. Given those views, it makes sense that about half of journalists (52%) say it is not possible to report news that nearly everyone finds accurate (see Chapter 5).
At the same time, journalists are far more confident that their audience trusts the news organization they work for (or the main one they work for if they work for more than one). Fully 83% of journalists think their audience has at least a fair amount of trust in the information they get from their news organization, including 35% who say their audience has a great deal of trust. Another 13% say their audience has some trust, while just 3% say their audience has “a little” or no trust at all.
The question to the public was a little different. The February 2022 survey of U.S. adults asked about the level of trust they have in the information they get from news organizations. About three-in-ten adults overall (29%) say they have a great deal or fair amount of trust in this information, and 27% say they have some trust. A plurality (44%) say they have “a little” or no trust.
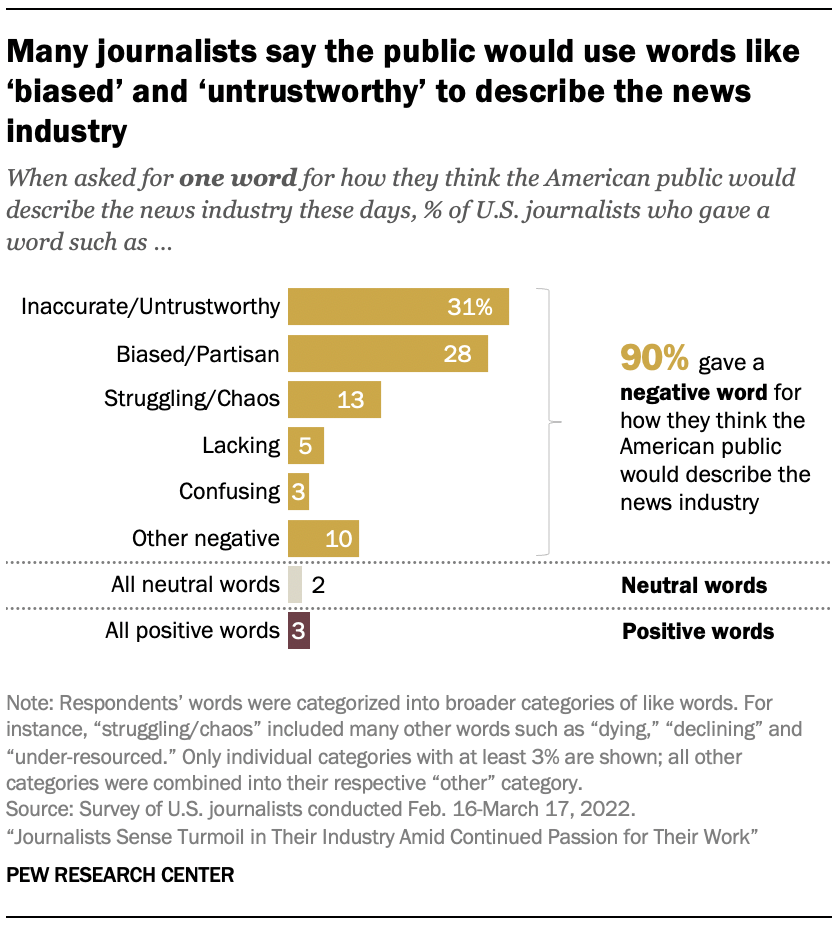
Journalists’ negative sense of how the public views journalism in general comes through even more strongly in the one word they think the public would use to describe the news industry today.1 Overall, nine-in-ten responses provided a negative word. Just 3% suggested the public would use a positive word (such as “important”), while 2% were neutral in tenor.
Two concepts alone accounted for about six-in-ten responses: 31% of journalists think the public’s views of the news media are summed up with words like “inaccurate” or “untrustworthy,” while 28% offered words such as “biased,” “partisan” or “divisive.”
See Chapter 1 for how journalists would use one word to describe their own view of the industry today.
Many journalists feel connected to their audiences; the public doesn’t feel the same level of connection
Another disconnect between the public and journalists is how connected each group feels to the other. Among journalists, close to half (46%) say they feel extremely or very connected to their audience, while another 37% say they feel somewhat connected. Far fewer – 16% – say they feel little or no connection.
Tied to this, nearly four-in-ten journalists surveyed (38%) say they interact with the public about their own work or the work of their organization one or more times a day, and an additional 21% do so several times a week. Among those who do interact with the public, the vast majority (83%) say these interactions are helpful.
The public feels considerably less connected to their news sources than journalists do with their audiences. In another representative survey of 10,441 U.S. adults conducted March 7-13, about a quarter of Americans (26%) say they are extremely or very connected to their main news organizations, far lower than the 46% of journalists who feel extremely or very connected to their audiences. Another 37% of Americans say they feel somewhat connected to their main news sources, while 36% feel little to no connection.
Previous Center research has found that a slim majority of Americans feel it is important to be connected to the outlets where they get their news, and that those who feel more connected tend to feel more positively toward the news media.
Journalists express confidence in their sources but rarely interview them in person
One reporting element that the public may deem important is the mix of sources journalists use in their stories. In an earlier study, for example, about half of U.S. adults say that when deciding which outlets to get their news from, it is at least somewhat important that news stories cover people like them.
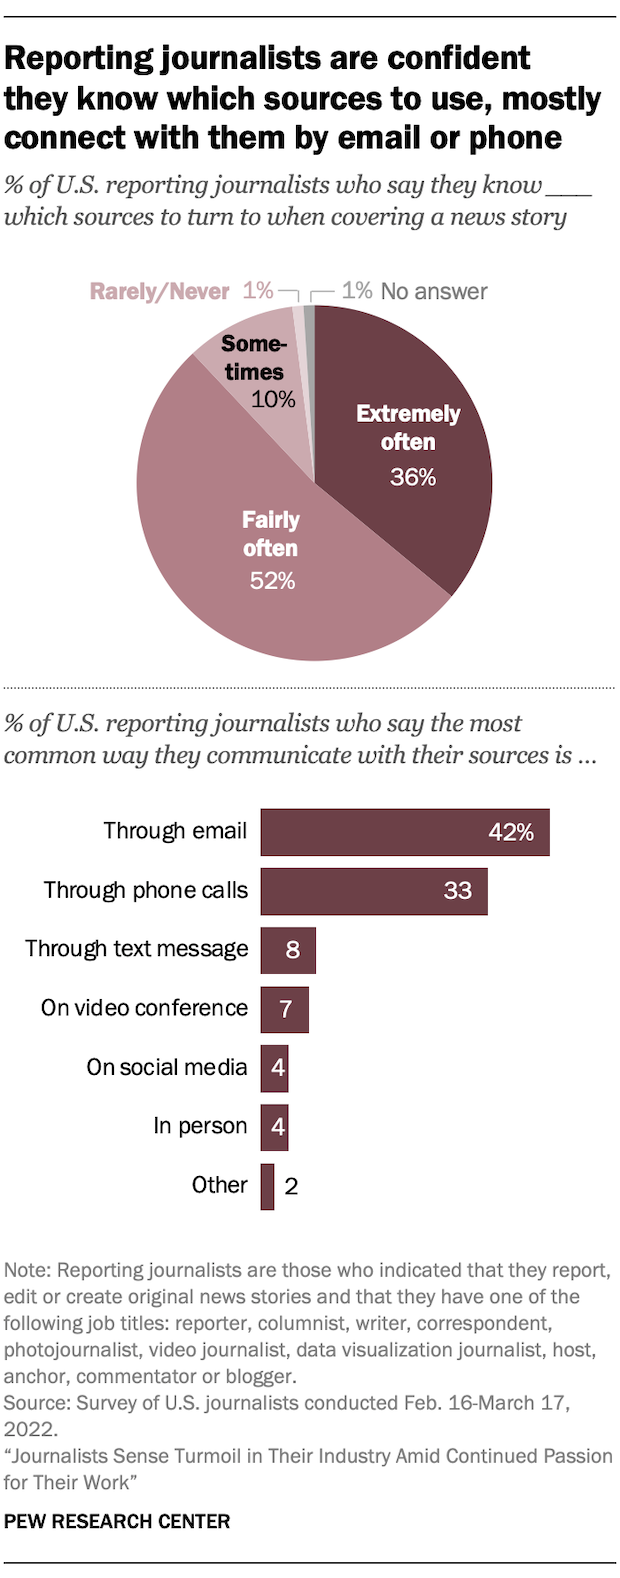
Overall, reporting journalists feel quite confident that they know which sources to turn to when covering a story. (Reporting journalists are those who indicated in the survey that they report, edit or create original news stories and that they have one of the following job titles: reporter, columnist, writer, correspondent, photojournalist, video journalist, data visualization journalist, host, anchor, commentator or blogger. About three-quarters of all journalists in this study – 76% – are reporting journalists.)
Roughly a third (36%) of reporting journalists say they know which sources to turn to extremely often, and another 52% say they feel this way fairly often. Whether related to the pandemic or a reflection of technology and deadline pressures, few conversations with sources happen in person today. Only 4% of reporting journalists say they mainly communicate with sources in person; the largest share say they connect with sources mostly through email (42%), and a third mostly rely on phone calls (33%). Text messages (8%), video conferences (7%) and social media (4%) are the primary ways other reporting journalists connect with sources.
5. Journalists see political sorting of news audiences as a much bigger problem than the public does
BY JEFFREY GOTTFRIED, AMY MITCHELL, MARK JURKOWITZ AND JACOB LIEDKE
Americans’ increased political polarization has also played out in the news environment in various ways, including the sources people turn to for news, what they believe about certain current events, and their views of the news media more broadly. As a part of this study, researchers explored the thoughts of journalists themselves about the impact of the country’s political dynamics on journalism and the information environment more broadly.
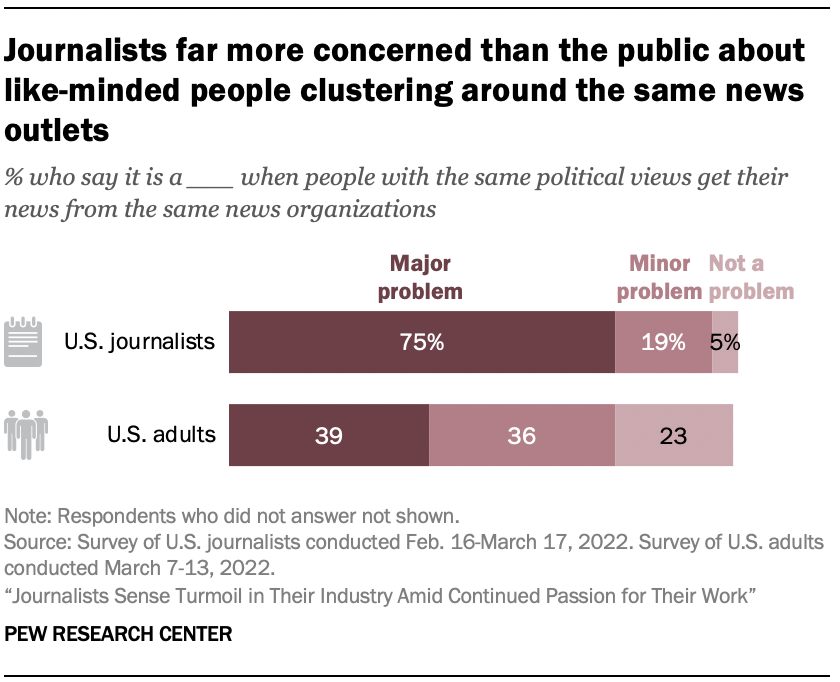
Overall, journalists are far more concerned than the American public about people with similar political views getting news from the same sources. Three-quarters of journalists surveyed say this is a major problem, and another 19% say it is a minor problem. Just 5% do not see it as problematic.
This concern cuts across both journalists who say their news organization’s audience leans to the right politically and those who say their audience leans left. (Those working for more than one organization were asked about the main one they work for.) Among those who say their organization’s audience leans to the right politically, nearly three-quarters (73%) say the political sorting of news audiences is a major problem, as do 71% of those whose audience leans to the left and 79% of those who say their audience is more politically mixed. (See Appendix for the portion of the sample who say their organization’s audience leans one way or the other politically.)
The American public is not as concerned. In a separate representative survey of 10,441 U.S. adults conducted March 7-13, roughly four-in-ten U.S. adults (39%) say it is a major problem when people with similar political views get news from the same organizations. About the same percentage (36%) say it is a minor problem, while 23% say it is not a problem at all – nearly five times the share of journalists.
Journalists less likely than the public to say each side of a story always deserves equal coverage
Another area of journalism that is often seen through a political lens is the question of news stories representing “all sides” of an issue and/or giving equal voice. This concept is often referred to as “bothsidesism” in journalism – which revolves around whether those making false statements or unsupported conjecture warrant as much attention as people making factual statements with solid supporting evidence.
This debate gained a new level of intensity during Donald Trump’s presidency and the widespread disinformation and competing views around both the 2020 election and the COVID-19 pandemic.
A small majority of journalists (55%) say that every side does not always deserve equal coverage, while 44% say journalists should always strive to give every side equal coverage.
The American public, on the other hand, expresses much stronger support for the concept of equal coverage. In another representative survey of 9,388 U.S. adults conducted Feb. 7-13, about three-quarters of U.S. adults (76%) express the view that journalists should always strive to give every side equal coverage. Majorities in both parties feel this way, although Republicans and those who lean toward the GOP (87%) are more inclined than Democrats and Democratic leaners (68%) to hold this view.
This is also an area where journalists themselves disagree based on the political leaning of their news organization’s audience. Journalists who say their news organizations have audiences that lean to the right politically are much more likely to endorse equal coverage of all voices than those who say their organizations’ audiences lean left. Nearly six-in-ten journalists with right-leaning audiences (57%) say journalists should always strive to give equal coverage, almost twice the share who say this among those with left-leaning audiences (30%), and somewhat higher than the share among journalists who say their outlet has a politically mixed audience (49%).
Journalists have mixed views on whether they can keep their personal views out of their reporting
One of the central questions about bias in news coverage is whether journalists can detach their personal views from their work. While journalists strongly agree that they should keep their personal views out of their reporting, there is less agreement over whether they are able to do so.
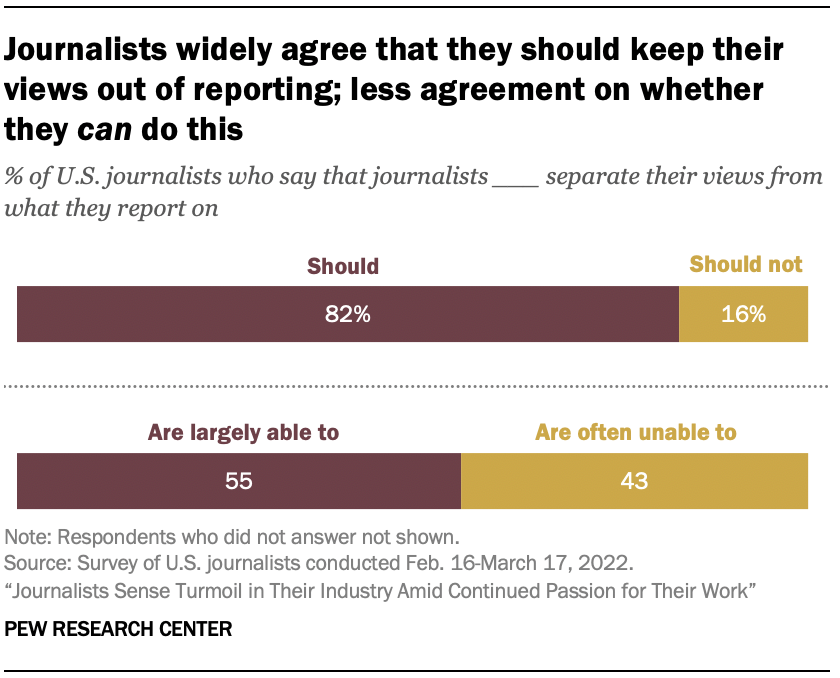
A large majority of journalists surveyed (82%) say journalists should separate their views from what they report on. A considerably smaller majority (55%) think journalists are largely able to do this, while 43% say journalists are often unable to do so.
These figures are similar regardless of journalists’ audience makeup: 55% of those who say their organization’s audience leans to the right politically feel journalists are largely able to separate their views from their reporting, as do 52% of those who say their audience leans left and 58% who say their organization’s audience is politically mixed.
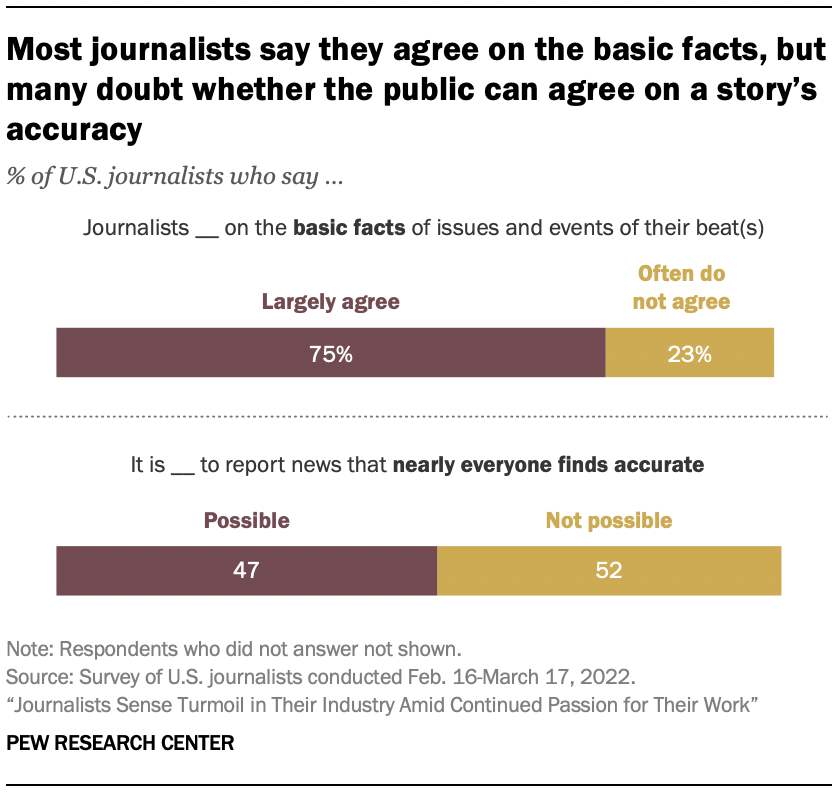
Still, three-quarters of U.S. journalists believe in journalists’ ability to agree on the basic facts of issues and events in the topic area (or beat) they cover, even if journalists report on these facts in different ways.
Many journalists acknowledge that significant segments of the public will not find their stories accurate. About half of journalists in the survey (52%) say it is not possible to report news that nearly everyone finds accurate, while 47% say it is possible to do so.
The public is even more pessimistic than journalists on this front, with 62% saying it is not possible to report news that nearly everyone finds accurate, far more than the 37% who say this is possible.
6. Journalists give industry mixed reviews on newsroom diversity, lowest marks in racial and ethnic diversity
BY JEFFREY GOTTFRIED, AMY MITCHELL, MARK JURKOWITZ AND JACOB LIEDKE
The responses from the almost 12,000 journalists surveyed suggest that newsroom diversity is a work in progress: Journalists give their news organizations mixed grades on how well they are doing in building a sufficiently diverse staff. There is broader agreement that organizations generally treat staff fairly, regardless of age, gender, or race and ethnicity. Still, fewer than half of journalists say their organization makes issues of diversity and inclusion a major priority, and about half have participated in a formal training session about diversity in their workplace in the past year.
Along with the makeup of the newsroom itself, many experts say diversity can have a significant impact on the quality of journalism because a more diverse staff is likely to produce a wider range of stories and perspectives. As discussed in Chapter 4, fewer journalists say that news organizations do a good job at giving voice to the underrepresented than they do for a number of other core functions of journalism.
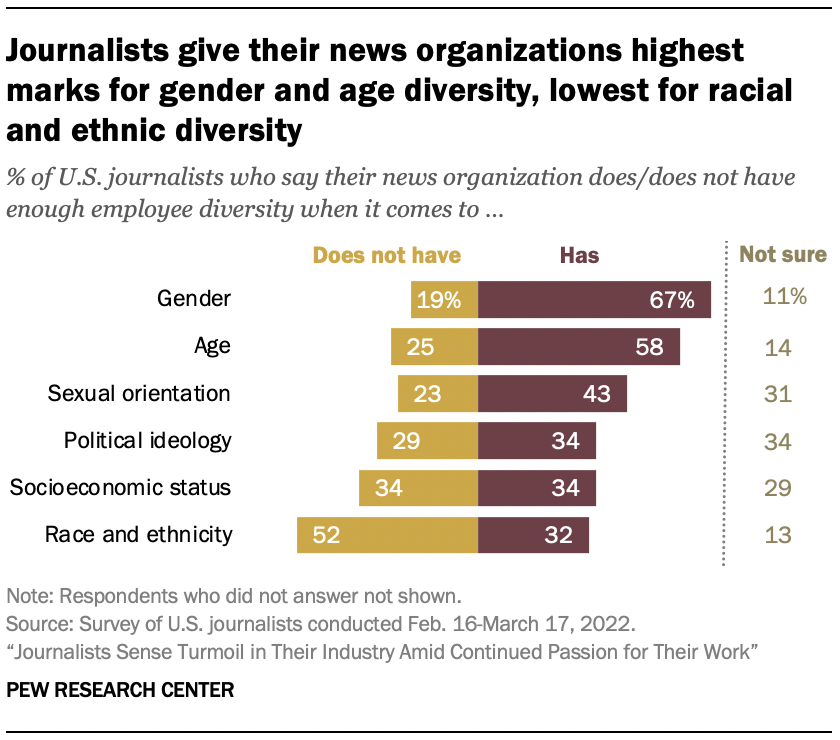
The survey asked journalists whether their news organization (or the main one they work for if they work for more than one) has enough employee diversity in several areas. Most say there is enough diversity in their newsrooms when it comes to gender and age. Two-thirds of journalists surveyed (67%) say their organization has enough gender diversity among its employees, compared with 19% who say it does not. And 58% say there is enough age diversity in their workplace, more than twice the share who say there is not (25%).
But journalists give lower marks for the levels of diversity in other areas. When it comes to diversifying the workplace by sexual orientation, 43% say their employers have enough employee diversity in this area, compared with 23% who say there is not enough and 31% who are not sure. About one-third say there is enough diversity when it comes to political ideology and socioeconomic status at their workplace (34% each). Another 34% and 29%, respectively, are unsure whether their organization has created sufficient diversity in each of these categories. This may speak to less transparency in those areas, or perhaps to uncertainty over how much diversity is “enough.”
Journalists give their news organizations the most negative ratings in the area of racial and ethnic diversity. By a considerable margin, more journalists say their organization does not have enough racial and ethnic diversity (52%) than say it does (32%).
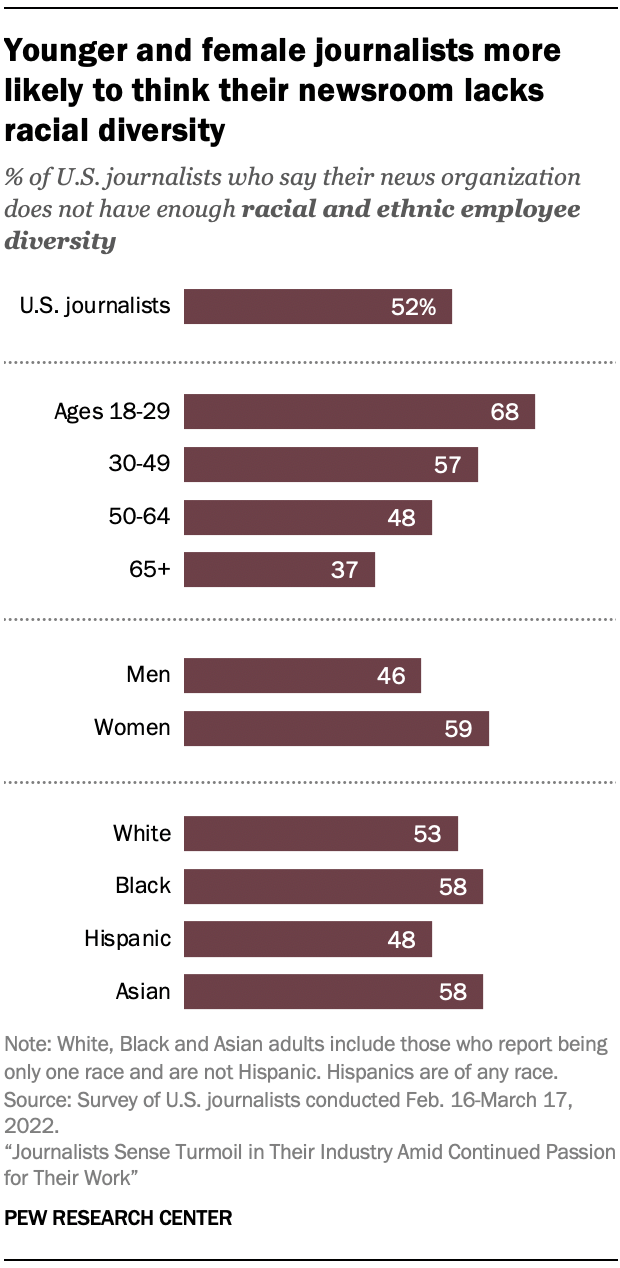
Underneath the overall numbers are some clear differences in views across demographic groups – particularly age and gender. Younger and female journalists are often more likely than their older and male peers to think there is not enough diversity in their organizations. For example, 68% of journalists ages 18 to 29 say there is not enough racial and ethnic diversity at their organization, compared with 37% of journalists 65 and older. Those ages 30 to 49 and 50 to 64 fall somewhere in between at 57% and 48%, respectively. (See Chapter 7 for a deeper look at journalists’ views by age.)
On the same question about racial and ethnic diversity, a majority of journalists who are women (59%) say there is not sufficient diversity in their newsroom, compared with 46% of men.
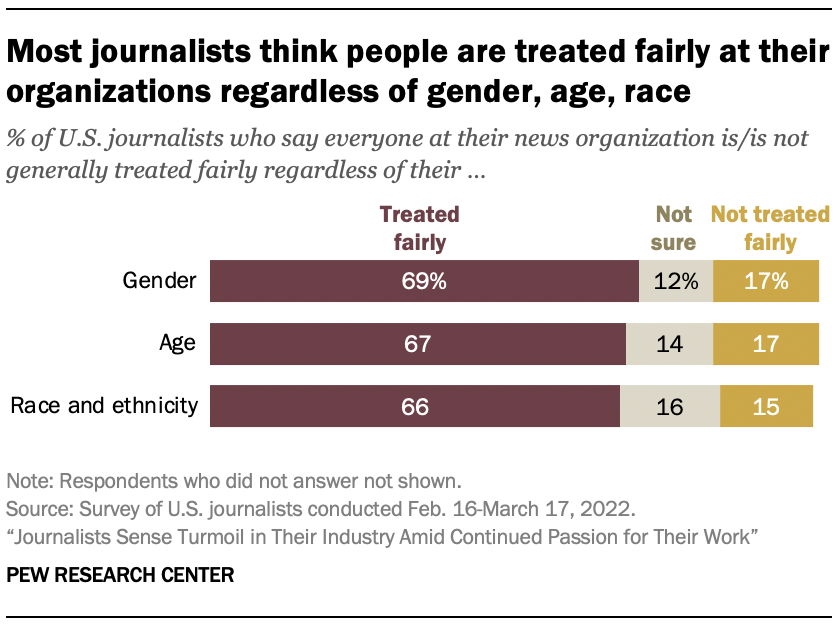
Despite concerns about diversity at their organizations, about two-thirds of all journalists (66%) say their colleagues generally are treated fairly regardless of their race and ethnicity – similar to the shares who say staffers are treated fairly regardless of their age (67%) and gender (69%). In each case, between 15% and 17% say people are not treated fairly based on these factors, while the remainder are either not sure or decline to answer the question.
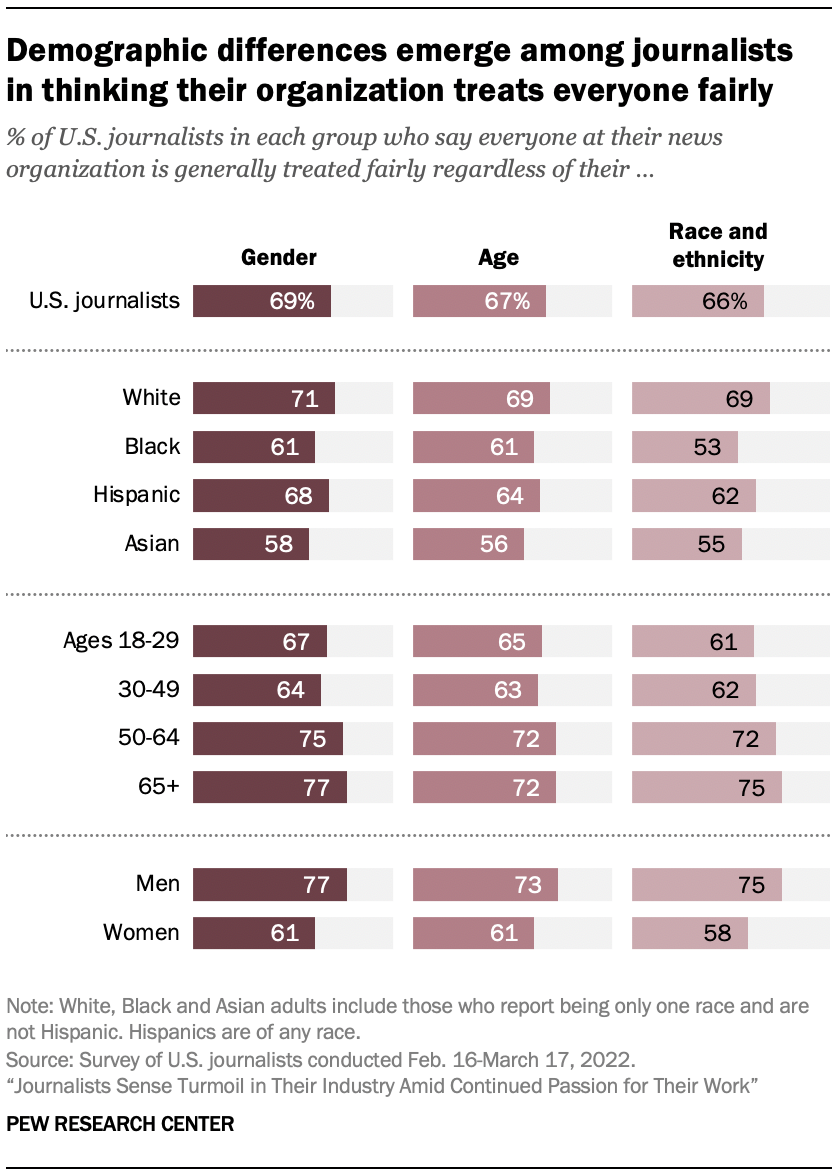
But again, there are differences on these questions based on the demographic characteristics of respondents. Asked about fair treatment of staffers inside the news organization, Black, Hispanic and Asian journalists are often less likely than White journalists to say that employees are treated fairly in all three areas — gender, age, and race and ethnicity – and in each case more likely to think that employees are not treated fairly. The same pattern applies to female journalists compared with male journalists, and for younger journalists compared with their older colleagues. (See Appendix for a detailed demographic profile of the journalists who completed the survey.)
For example, 53% of Black journalists and about the same portion of Asian journalists (55%), as well as 62% of Hispanic journalists, say that employees at their organizations are treated fairly regardless of their race and ethnicity, lower than the 69% of White journalists who say this. About a third of Black journalists (34%) say that everyone at their organization is not treated fairly regardless of their race and ethnicity, as do 29% of Asian journalists and 25% of Hispanic journalists – all higher than the 12% of White journalists who say the same.
Similarly, there is a 16-point gap between men (77%) and women (61%) in the share of journalists who say employees at their news organization are treated fairly regardless of their gender. On the other hand, 24% of female journalists say that employees at their organization are not treated fairly regardless of their gender, more than twice that of male journalists (10%).
About half of journalists took part in workplace diversity training in the past year; more likely among Black, Hispanic and Asian journalists
Fewer than half of the journalists surveyed say their organization places a great deal of focus on issues of diversity and inclusion at the workplace – 42% indicate it is a major priority for their organization. Another 30% characterize it as a minor priority, 16% say it is not a priority at all and 10% are unsure.
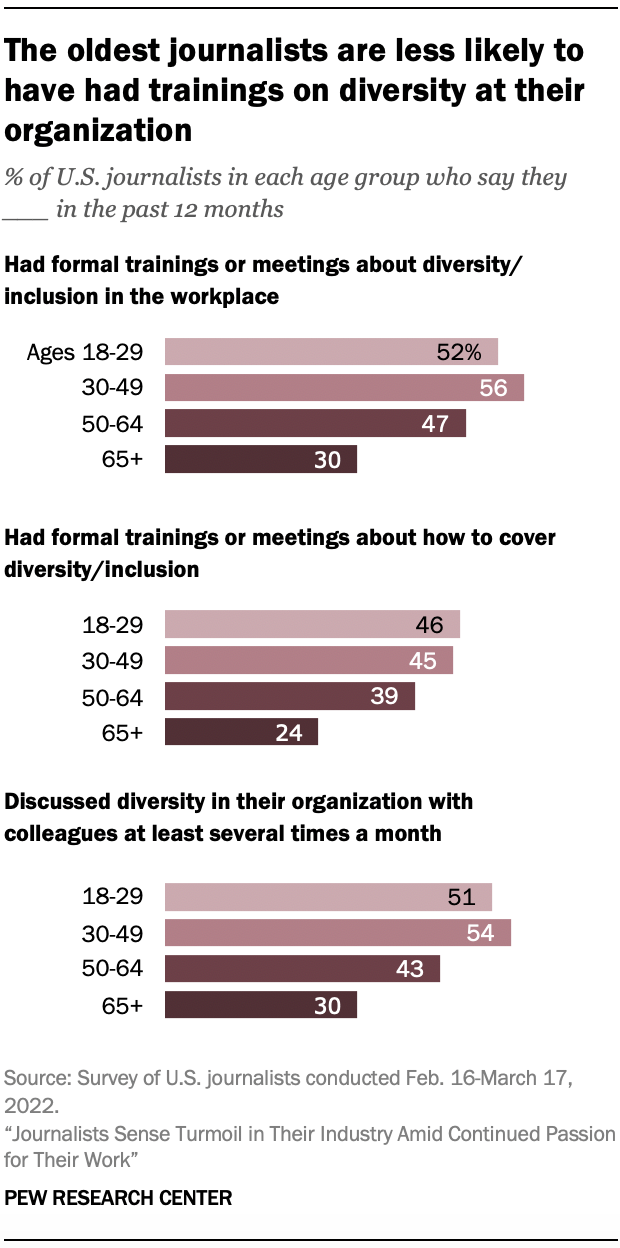
About half of all journalists (48%) say they have participated in formal trainings or meetings on diversity and inclusion in their workplace in the past 12 months – and four-in-ten have participated in sessions on how to cover these issues in the news. Perhaps not surprisingly, those who say their news organizations make diversity and inclusion a major priority are much more likely to have participated in these trainings. On a more informal level, 46% of the journalists surveyed say they discuss the topic of diversity with colleagues at least several times a month.
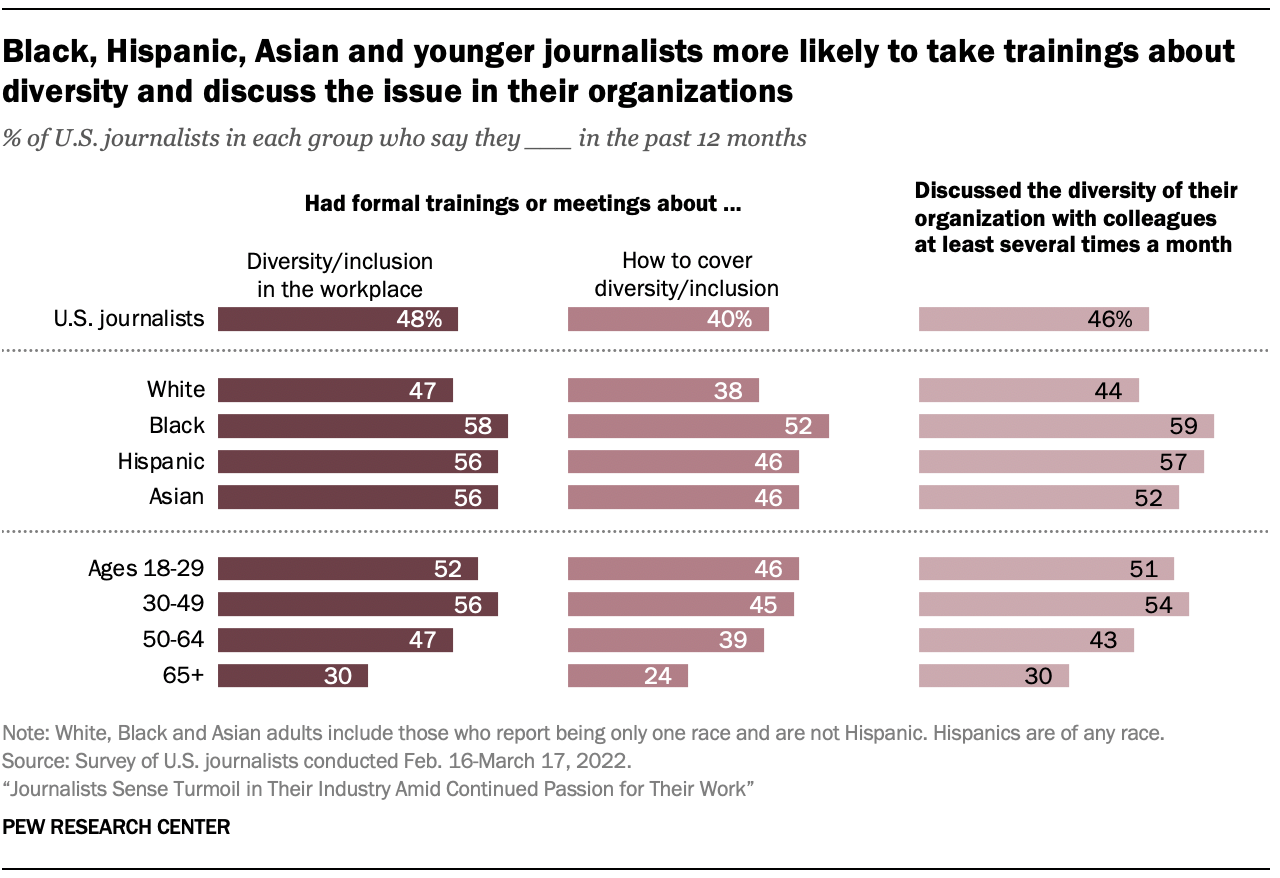
Black, Hispanic and Asian journalists are more likely than White journalists to say they engage in both training and informal discussions about issues of diversity and inclusion in their newsroom. Roughly six-in-ten Black (59%) and Hispanic (57%) journalists say they discussed diversity in their organization with colleagues at least several times a month in the past year, as do 52% of Asian journalists – compared with 44% of White journalists.
Large differences also emerge between age groups. For instance, 46% of journalists ages 18 to 29 as well as 45% of those 30 to 49 have had formal meetings or trainings about how to cover diversity and inclusion over the past 12 months, almost twice the rate of those 65 and older (24%).
Journalists who say their news organization has a left-leaning audience are more likely to engage with diversity issues, see diversity shortfalls
Journalists who say the audience of the organization they work for leans left politically are much more likely than those who say their audience leans right to engage with the issue of diversity at their organization, to say diversity and inclusion is a focus at their organization, and to see less diversity in some areas at their news organizations.
A majority of those who say they work for organizations with left-leaning audiences (56%) say issues surrounding diversity are a major priority, more than twice the share of those with right-leaning audiences (23%), and also higher than the share among journalists with more politically mixed audiences (42%).
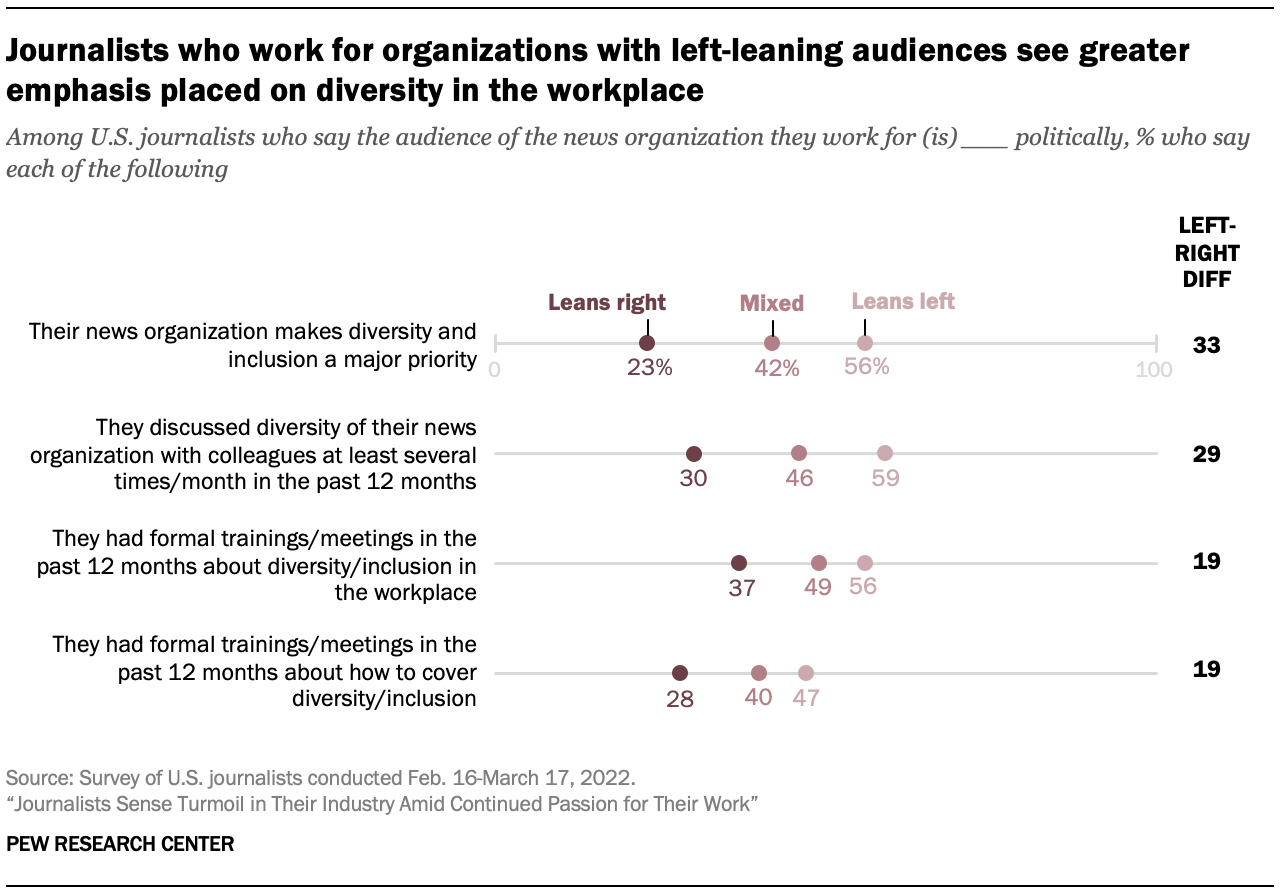
Similarly, 56% of journalists who work for organizations with left-leaning audiences say they have had formal trainings or meetings on diversity in their workplace in the past 12 months, compared with 37% of journalists at outlets with right-leaning audiences and 49% of those with more mixed audiences who report these experiences. This pattern holds when it comes to having discussions with colleagues about their organization’s diversity.
Journalists who work for organizations with left-leaning audiences also are somewhat more likely to see their organizations as lacking in diversity in the areas of political ideology and socioeconomic status. For instance, 44% of journalists who work for organizations with left-leaning audiences say there is not enough political diversity in their newsroom, compared with 26% of those who say they work for organizations with right-leaning audiences and 22% of those with more politically mixed audiences.
Freelancers far less engaged with issues of diversity at news organizations
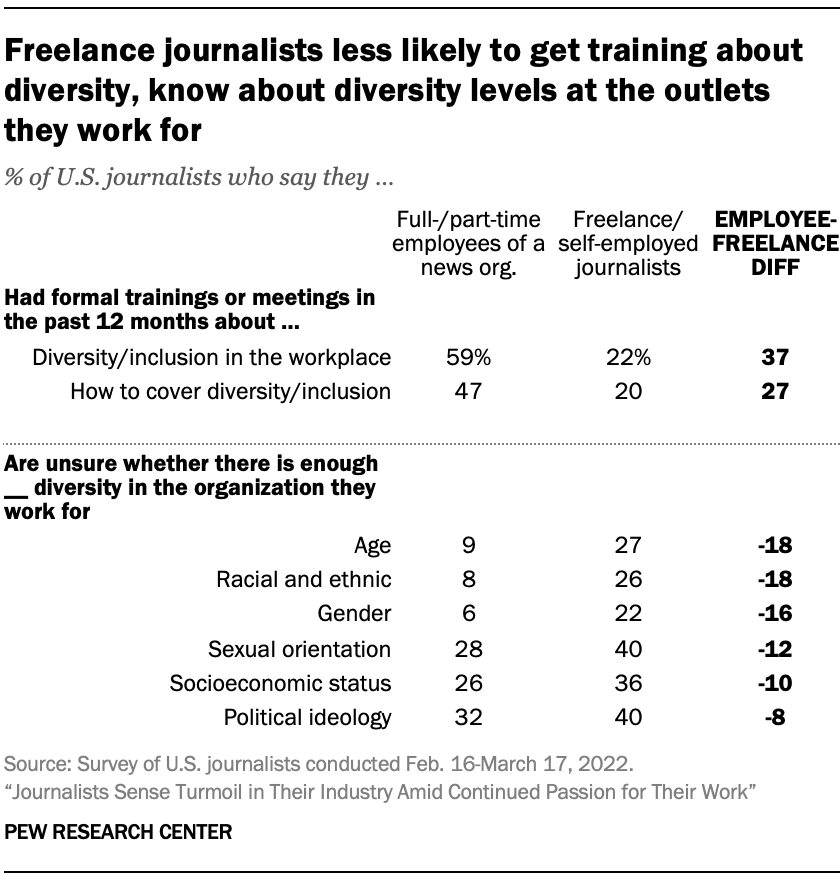
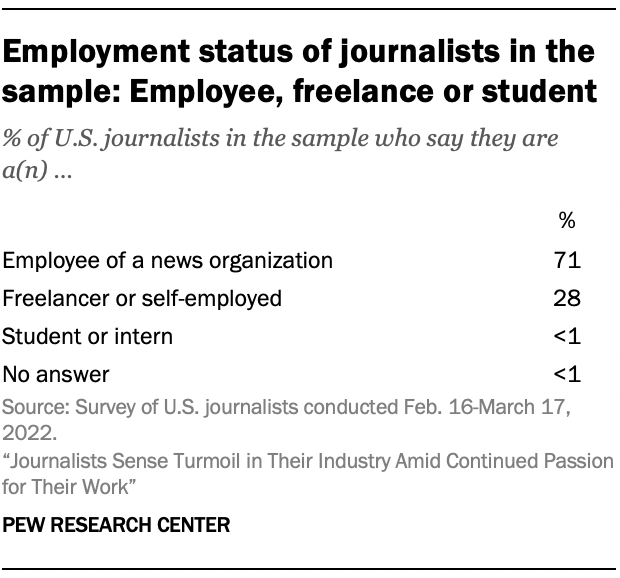
The 28% of journalists in the survey sample who identify as freelancers or are self-employed tend to be less engaged with issues of diversity and inclusion at the organizations that they work for. For example, one-in-five freelance or self-employed journalists say they had a formal training about how to cover issues of diversity and inclusion in the past year, substantially lower than the 47% of full- or part-time employees of news organizations. Freelance or self-employed journalists are also much more likely to be unsure of the level of diversity of the organizations they work for.
7. Older journalists most content in their work, younger journalists more likely to find social media helpful
BY JEFFREY GOTTFRIED, AMY MITCHELL, MARK JURKOWITZ AND JACOB LIEDKE
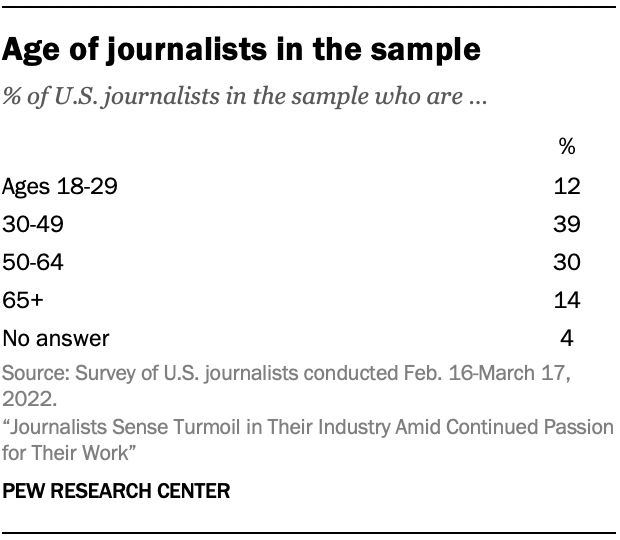
In many cases, journalists’ views on the topics addressed in this survey vary by age, with the starkest differences frequently showing up between the youngest and oldest groups of the journalists surveyed. (See Appendix for a detailed breakdown of the sample by age.)
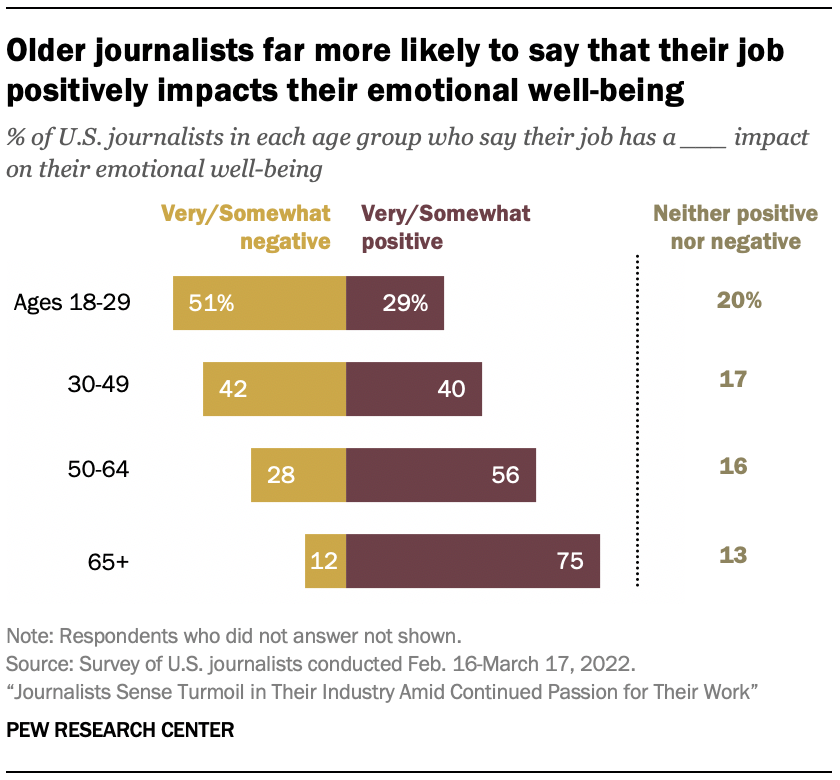
One of the largest gaps between age groups emerges around the question of what impact respondents’ jobs have on their emotional well-being. Three-quarters of journalists ages 65 and older say their job has a very or somewhat positive impact on their emotional well-being. But among journalists ages 18 to 29, that number plummets to about three-in-ten (29%). Instead, roughly half of all journalists under 30 (51%) say their job has a negative effect on their emotional well-being.1
In a related area, journalists 65 and older are less likely to report having experienced at least one incident of job-related threat or harassment from someone outside their news organization in the past year (30%). That percentage increases to about half among those ages 18 to 29 (50%) and 30 to 49 (48%).
Among journalists who report experiencing some kind of harassment from someone outside their organization, younger journalists are more likely to have experienced at least some of it through social media: 82% of journalists under 30 say at least one of the incidents of harassment they experienced in the past year was on social media, versus 66% of those 65 and older.
Overall, journalists of all age groups are far more likely to say social media’s impact on the state of journalism in the U.S. has been negative rather than positive. But younger journalists stand out from their elders in their assessments of how social media can aid in a number of specific tasks related to their jobs.
Among journalists who use social media for their job, 89% of those ages 18 to 29 say social media has a very or somewhat positive impact on their ability to identify stories that should be covered, 25 percentage points higher than those 65 and older (64%). A similar percentage of the youngest journalists (91%) say social media has a positive impact on finding sources for stories, again higher than the oldest group (71%).
Younger journalists less satisfied with their organization’s diversity efforts
There also are noteworthy gaps between journalists of different age groups on issues related to newsroom diversity and inclusion. In many areas, younger journalists are more likely than their older peers to say their organization (or the main one they work for if they work for more than one) does not have sufficient diversity, including racial and ethnic diversity, with 68% of journalists ages 18 to 29 saying there is not enough diversity in this area at their organization, compared with 37% of those 65 and older. Another large gap exists on the issue of socioeconomic diversity: 44% of those ages 18 to 29 say their organization does not have enough diversity in this area, compared with 22% of those 65 and older.
Overall, a majority of the journalists surveyed in each age group say everyone in their organization is treated fairly, regardless of race and ethnicity, but younger journalists are somewhat less likely to do so: About six-in-ten journalists ages 18 to 29 (61%) and 30 to 49 (62%) say this, compared with 72% of journalists ages 50 to 64 and 75% of those 65 and older.
The oldest group of journalists is also considerably less likely to have trainings or discussions about diversity and inclusion. For instance, while 45% of journalists under 50 say they have attended a formal training or meeting on how to cover issues of diversity in the news in the past year, about a quarter of journalists 65 and older (24%) have done so.
Oldest journalists most concerned about possible press restrictions, but also most satisfied in their jobs
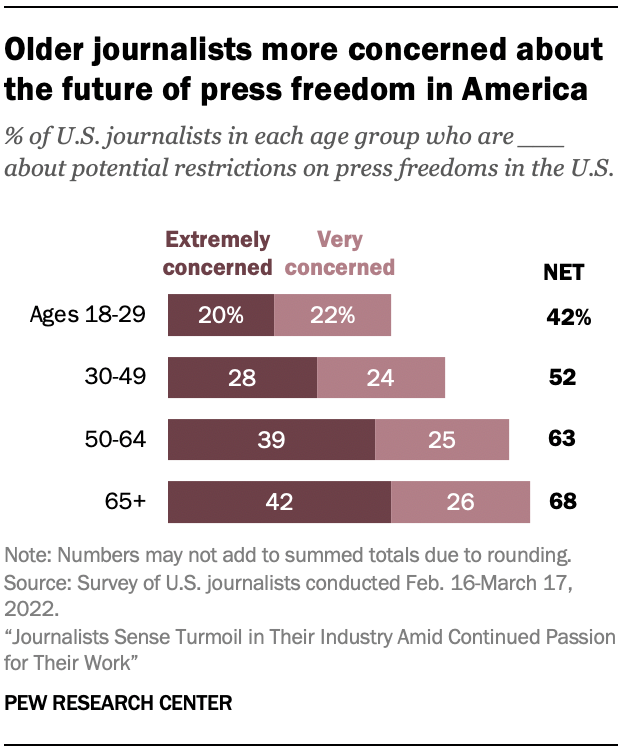
One issue that concerns older journalists more than younger ones is the prospect of restrictions being imposed on the profession. Roughly two-thirds of journalists ages 65 and older (68%) and those 50 to 64 (63%) say they are extremely or very concerned about potential restrictions on press freedoms in America. Smaller yet sizable percentages of journalists under 30 (42%) and ages 30 to 49 (52%) share these concerns.
Older journalists appear to be satisfied with their work somewhat more than the rest of their colleagues. Though majorities of each age group express high levels of satisfaction, those 65 and older outpace other age groups in the share who are very or somewhat satisfied with their job.2 And about four-in-five journalists in this age range (83%) say they are very or extremely proud of the work they produce, compared with 68% of journalists ages 18 to 29.
In another measure related to job satisfaction, journalists 65 and older feel the most connected to their audiences. About two-thirds (66%) say they feel extremely or very connected, far more than the share of those ages 18 to 29 (29%) and 30 to 49 (37%) who say the same.
8. TV journalists most likely to experience harassment; online outlets most likely to see newsroom expansion
BY JEFFREY GOTTFRIED, AMY MITCHELL, MARK JURKOWITZ AND JACOB LIEDKE
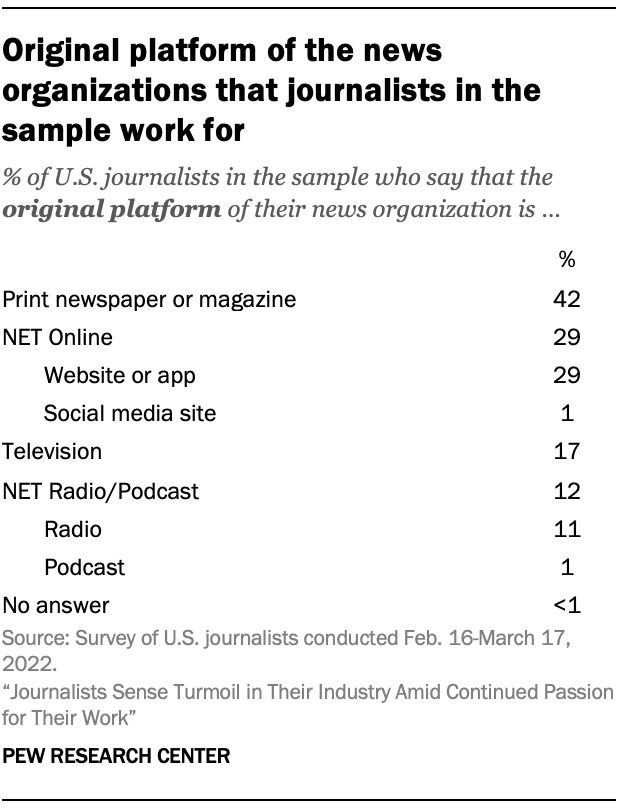
Journalists surveyed were asked to give the original platform of the news organization they work for (or the organization they work for most). This study compares the experiences and attitudes of journalists across four broader platform groups: print, television, radio and podcasts, and online, including websites, apps and social media sites. (See Appendix for a detailed breakdown of the sample by the original platform of the organizations respondents work for.)
In some ways, journalists’ experiences and opinions are similar for all platforms studied. But differences do show up – with the views of journalists working in legacy television news often the ones that stand out.
For instance, solid majorities of journalists in all platform groups express satisfaction with their jobs, but there are some consistent differences – mainly between television journalists and those in the other three groups. TV journalists are the least likely to say they are very or somewhat satisfied with their jobs (61%, vs. 70% or more of print, radio/podcast and online journalists). The same modest differences apply to how excited journalists feel about their work.
In another area, the gap is larger. About one-third of television journalists (34%) say their job has a very or somewhat positive impact on their emotional well-being. Journalists who work online (54%) and in print (52%) are far more likely to say this of their work.
Television journalists’ responses regarding their job’s impact on their emotional well-being may be connected to job-related harassment or threats that come from outside their newsroom. One-in-five TV journalists cite such harassment as a major problem, about twice the share of any other platform group. And about a quarter of TV journalists (24%) say harassment from someone outside their organization is not a problem, far lower than print (44%), radio and podcast (47%), and online (49%) journalists.
Given their conspicuous presence at events they cover (often accompanied by large cameras), it may not be surprising that 58% of television journalists say they have experienced job-related harassment from someone outside their news organization at least once in the past year. That’s considerably higher than the roughly four-in-ten among print (39%), online (38%) and radio (41%) journalists who say this has happened to them in the past year.
Online journalists most likely to say their organization is expanding
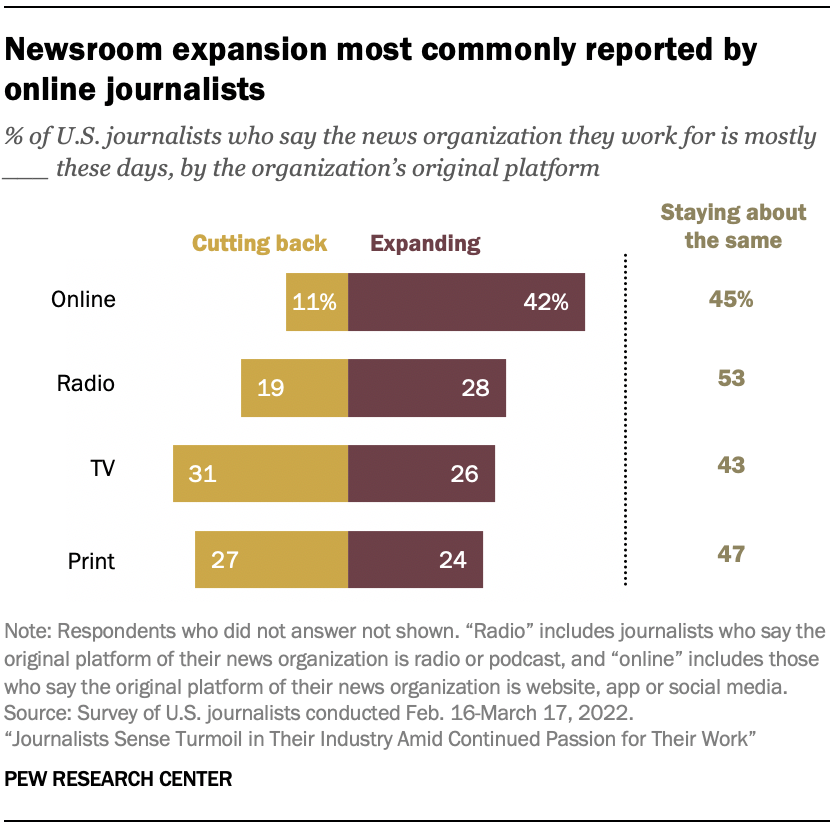
Journalists working for online news organizations are the most likely to say their organization is mostly expanding these days – 42%, compared with 11% who say it is cutting back (45% say it is staying about the same). Across the other three platform groups, only about one-quarter say their organization is expanding.
This finding is in line with previous Pew Research Center data that shows that while newsroom employment overall has dropped in recent years, particularly among newspapers, there have been considerable gains among digital-native outlets.
At the same time, about half of TV journalists (49%) say they received a salary increase in the past year. This was the case for 43% of online journalists, 38% of those working in radio or podcasts, and 36% of print journalists.
TV journalists most likely to want a license requirement
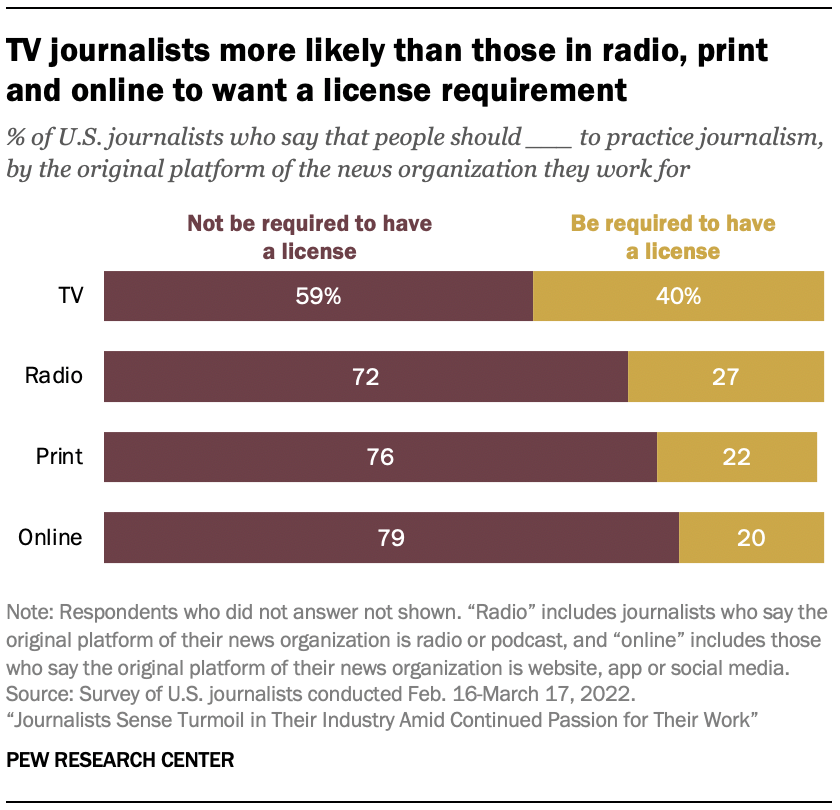
Majorities of journalists across platform groups say people should not be required to have a license in order to practice journalism. Television journalists are notably more likely than others to say a license should be required to practice journalism. In all, 40% of TV journalists surveyed favor a licensing requirement, about twice as many as online (20%) and print (22%) journalists. Those working in radio and podcasting fall in between, with 27% favoring a license.
It is worth noting that while there is no current licensing requirement for journalists themselves, radio and television stations are licensed and regulated by the Federal Communications Commission; there is no such regulatory authority for newspapers or online outlets.
Radio and podcast journalists feel most connected to their audience
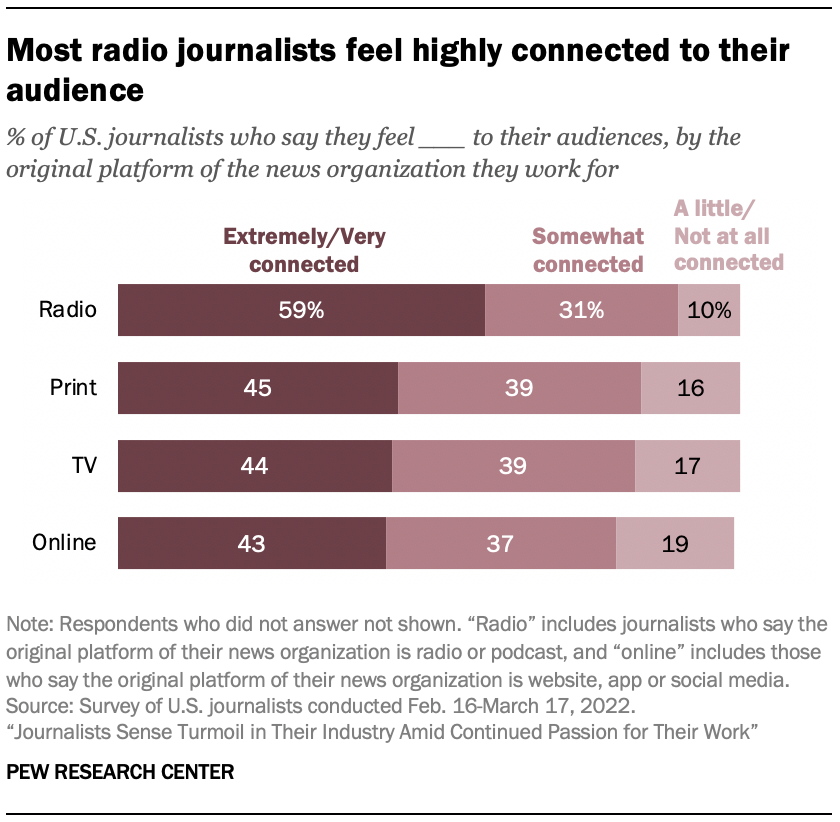
On the question of how connected journalists feel to their audiences, those working at organizations that originally started as radio or podcasts stand out. About six-in-ten (59%) say they feel extremely or very connected to their listeners – significantly higher than the 45% of print journalists, 44% of TV journalists and 43% of online journalists who say the same about their readers and viewers.
In a related finding, just under half of both radio and television journalists (44% and 46%, respectively) say they interact with the public at least once a day about their work or the work of their organization, higher than the roughly one-third of print (34%) and online journalists (35%) who report such interactions.
TV journalists are more likely to say their newsroom is diverse – and to take part in diversity trainings
In a number of ways, television journalists are more likely than journalists on other platforms to say their organizations are diverse enough. For instance, nearly half of TV journalists (47%) say their organization has enough racial and ethnic diversity, higher than the share of radio/podcast (34%), online (34%) and print (25%) journalists who say the same. TV journalists also are more likely than any other group to say their organization has enough diversity based on gender and sexual orientation.
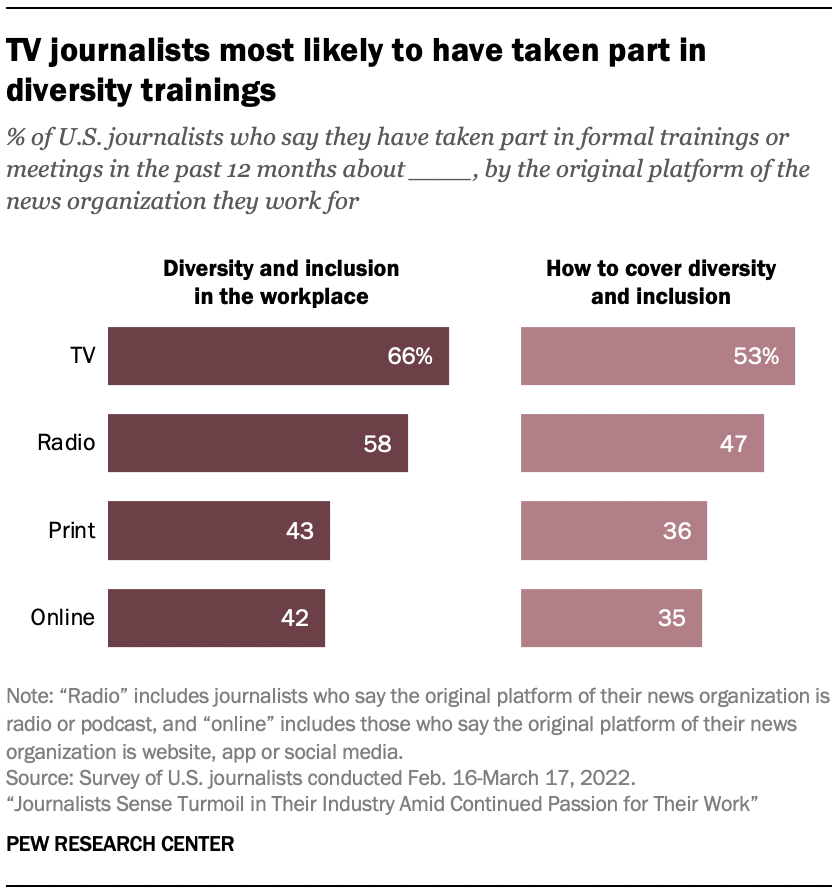
Similarly, television journalists are the most likely to say they have taken trainings on issues of diversity and inclusion. About two-thirds of TV journalists (66%) say they have had formal trainings or meetings about issues of diversity and inclusion in the workplace in the past year, far higher than the share of print (43%) and online (42%) journalists who report having these experiences. It follows, then, that TV journalists are the most likely of any platform group to say that their news organizations make diversity a major priority (51%).
Acknowledgments
BY JEFFREY GOTTFRIED, AMY MITCHELL, MARK JURKOWITZ AND JACOB LIEDKE
Pew Research Center is a subsidiary of The Pew Charitable Trusts, its primary funder. This is the latest report in Pew Research Center’s ongoing investigation of the state of news, information and journalism in the digital age, a research program funded by The Pew Charitable Trusts, with generous support from the John S. and James L. Knight Foundation. This report is a collaborative effort based on the input and analysis of the Center’s journalism and media research team, communications, design, digital and editorial teams. Find related reports online at journalism.org.
Research Team
Jeffrey Gottfried, Senior Researcher
Amy Mitchell, Director, Journalism Research
Mark Jurkowitz, Senior Writer
Jacob Liedke, Research Assistant
Mason Walker, Former Research Analyst
Andrew Mercer, Senior Research Methodologist
Elisa Shearer, Research Associate
Naomi Forman-Katz, Research Assistant
Emily Tomasik, Research Assistant
Sarah Naseer, Research Assistant
Galen Stocking, Senior Computational Social Scientist
Katerina Eva Matsa, Associate Director, Journalism Research
Kirsten Worden, Research Assistant
Shreenita Ghosh, Research Associate
Shane Savage, Temporary Data Assistant
Sarah Crawford, Research Assistant
Christopher St. Aubin, Temporary Data Assistant
Communications and Web Publishing
Nida Asheer, Communications Manager
Andrew Grant, Communications Associate
Rachel Weisel, Associate Director, Communications
Sara Atske, Associate Digital Producer
Editorial and Graphic Design
Michael Lipka, Editorial Manager, Religion Research
David Kent, Senior Copy Editor
Margaret Porteus, Information Graphics Designer
Andrea Caumont, Digital Engagement Manager
Isaac Mei, Associate Social Media Strategist
Appendix: Detailed tables of the composition of the journalist survey sample
BY JEFFREY GOTTFRIED, AMY MITCHELL, MARK JURKOWITZ AND JACOB LIEDKE
Methodology
BY JEFFREY GOTTFRIED, AMY MITCHELL, MARK JURKOWITZ AND JACOB LIEDKE
This report is primarily based on a Pew Research Center survey of U.S.-based journalists. The report also draws upon two nationally representative surveys of U.S. adults who are members of the Center’s American Trends Panel. More detail about each of these data sources is provided below.
This is the latest report in Pew Research Center’s ongoing investigation of the state of news, information and journalism in the digital age, a research program funded by The Pew Charitable Trusts, with generous support from the John S. and James L. Knight Foundation.
Survey of journalists
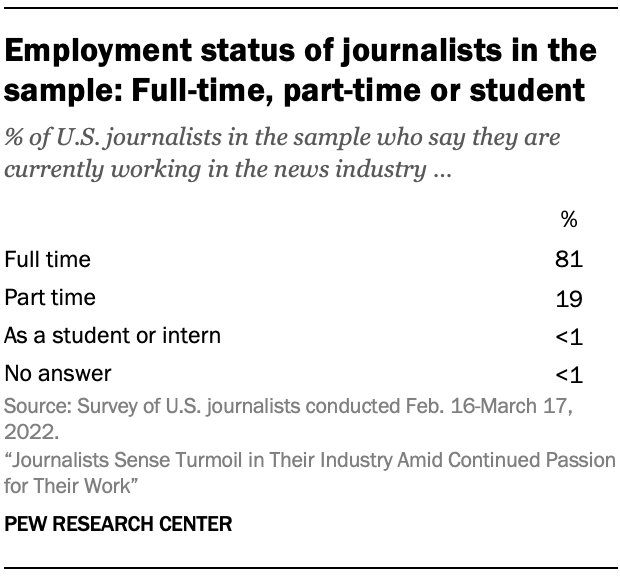
The main source of data for this report is a national survey of 11,889 U.S.-based journalists conducted for Pew Research Center by SSRS. The survey was administered online in English and Spanish from Feb. 16 to March 17, 2022. Estimates for the full sample have a margin of sampling error of plus or minus 1.0 percentage points.
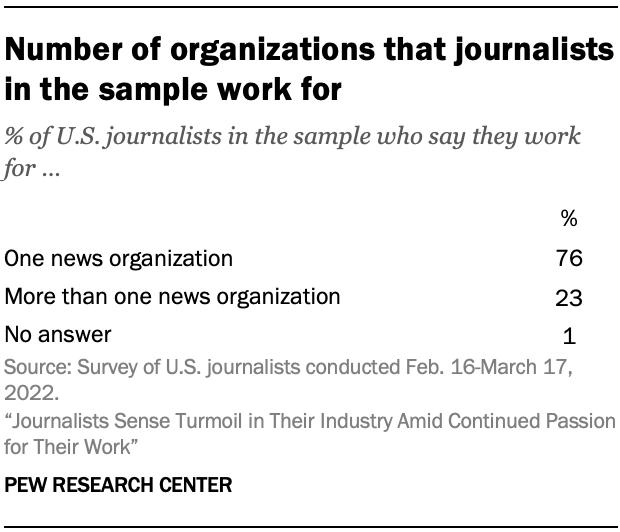
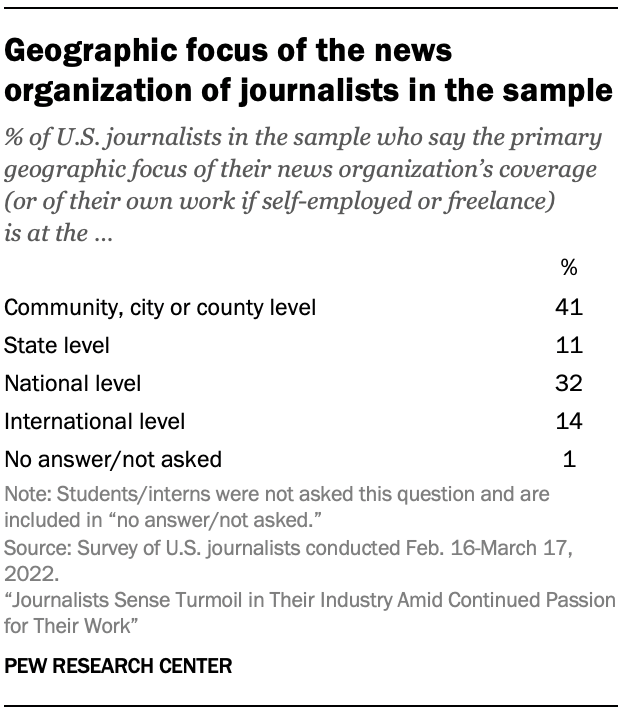
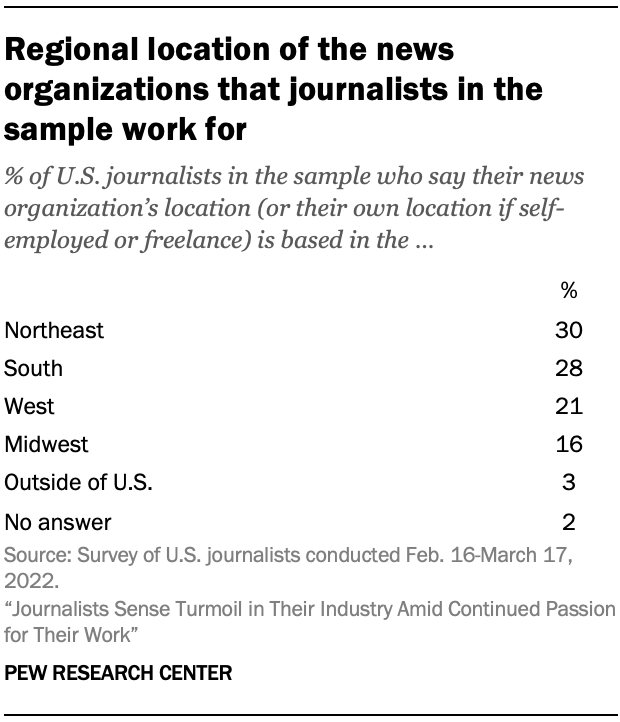
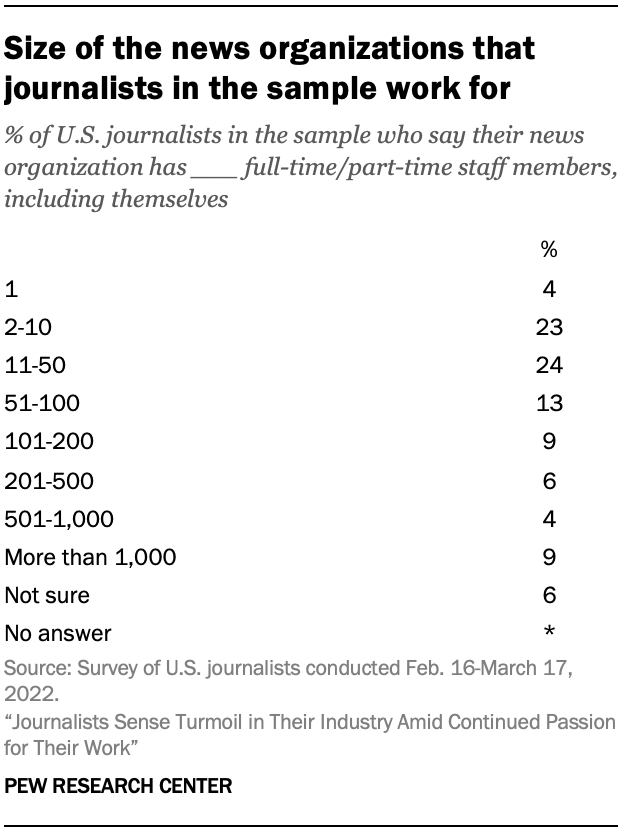
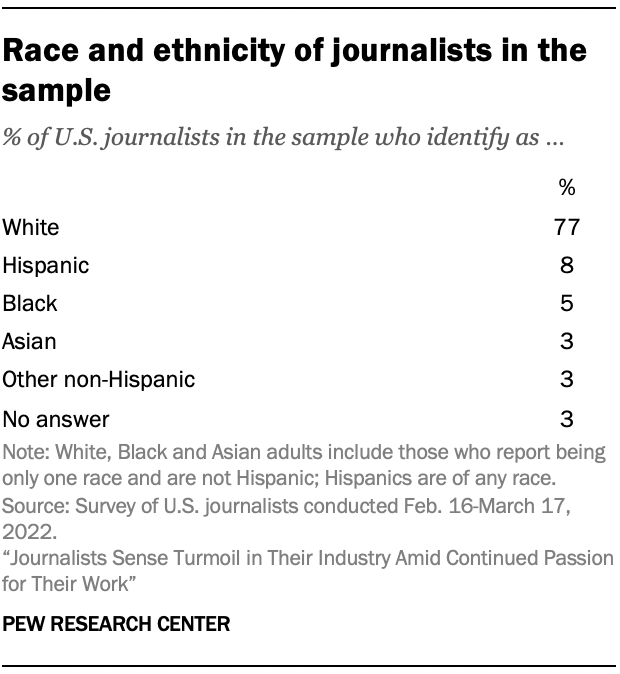
The target population for this study was defined as journalists working in the United States. For this study, journalists are defined as individuals currently working in the news industry who create, edit or report original news stories across a wide range of reporting areas and beats. See Appendix for a detailed profile of the sample across demographics, job title, employment status (e.g., full/part-time employees of a news organization vs. freelance or self-employed), size and type of news organization, and geographic location of their news organization, among other variables.
Sample design
Because there is no readily available list of all U.S. journalists, Center researchers combined multiple data sources to create a broad and diverse sample with the goal of finding and including journalists across as many types of outlets and areas of reporting as possible. The resulting sample was comprised of 167,886 individuals listed in commercial databases of journalists whose job title and media type identified them as likely to be a journalist according to the above definition.
The core of this list of journalists came from a commercial database of journalists maintained by Muck Rack. A second, supplementary commercial database of journalists was used to further improve coverage of U.S. journalists. To ensure that a broad range of journalists were invited to take the survey, researchers cross-referenced the outlets in both of these databases with supplementary lists of media outlets – often lists that have been maintained by academics who track specific segments of the U.S. news industry. Researchers identified the news organizations in these supplementary lists that were not found in either of the databases. A list of these organizations was provided to Muck Rack, which then incorporated information about journalists working at these organizations into its database, provided they met certain criteria such as the organization still being operational and having a web presence.
These supplemental lists of outlets broadened the study’s coverage of journalists in a number of ways, ensuring journalists were included from a variety of different reporting areas, news platform types, as well as outlet sizes and types – from national to hyperlocal newspapers, radio and television stations from the largest to the smallest media markets, ethnic media, nonprofit and independent news outlets, and social media news channels, among a wide range of others.
Next, researchers identified a list of job titles and media outlet types that most closely corresponded to this survey’s target population. The Muck Rack database was searched for records matching each combination of job title and outlet type that were located in the United States. Individuals identified in these searches were included in the sample of journalists. This process was repeated on the second commercial database of journalists, and any additional journalists who had not already been found in Muck Rack were also added to the list.
Finally, records in the list were processed and cleaned to identify and remove any invalid or duplicate records. Altogether, this process identified a total of 167,886 individuals that were potentially eligible to participate in the survey, all of whom were included in the sample.
Screening and eligibility
Because the searches of commercial databases may have returned many individuals who do not qualify as journalists under the study’s definition, at the beginning of the survey, respondents were asked their current job title in the news industry and if they report, edit or create original news stories. Respondents were deemed eligible if they provided their job title and indicated that they report, edit or create original news stories. If respondents said they do not currently work in the news industry; do not report, edit or create original news stories; or refused to answer either screening question, the interview was terminated.
Data collection
Sampled individuals were invited via email to take the survey online. The invitation included links to the survey and FAQs about the study. Because respondents’ preferred language could not be known in advance, the email was written in English but included Spanish language instructions linking to a Spanish translation of the study FAQ. The email also included a link allowing respondents to unsubscribe if they did not wish to participate in the study. Upon clicking the survey link, respondents were given the choice to take the survey in either English or Spanish before proceeding.
An initial soft launch of 1,000 survey invitations was performed on Feb. 16, 2022, to confirm that all survey systems were working correctly. Because of the large number of email invitations needed for this study, initial invitations for the remainder of the sample were sent in batches on either Feb. 18 or Feb. 22, 2022. (No invitations were sent on the intervening days due to the President’s Day holiday weekend.) A series of three reminder emails were sent approximately one week apart to individuals who had not yet completed the survey, unless they unsubscribed.
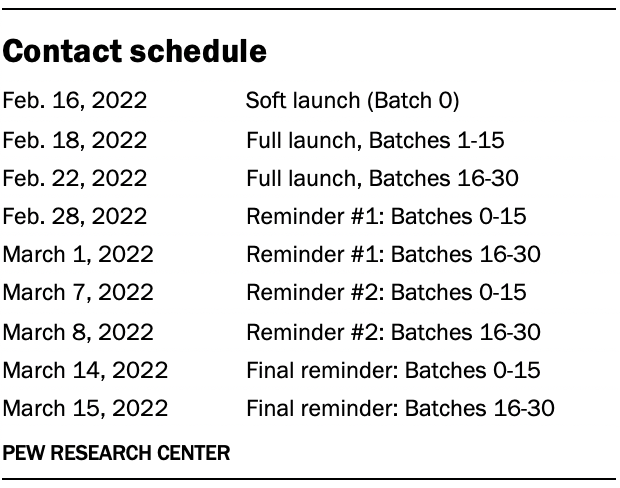
No breakout chains or routers were used in the administration of this survey.
Weighting
Unlike general population surveys which can be weighted to align with population parameters from the census and other federal surveys, there are no universally agreed upon benchmarks describing the composition of the population of U.S. journalists. Instead, propensity weighting was used to correct for potential error due to differential nonresponse.
The propensity weights were created to account for two stages of potential nonresponse: 1) completing the screening questions and 2) completion of the full survey among eligible screener respondents.
For the first stage, a random forest model was used to predict the probability that each individual in the sample successfully completed the screening questions. The inverse of these predicted probabilities was used to create an initial screener weight which was trimmed at the 99th percentile to reduce the loss in precision stemming from variance in the weights.
For the second stage, another random forest model was used to predict the probability of completing the full survey among journalists were determined to be eligible in the screener. For the second stage model, cases were weighted according to their first-stage screener weight.
For respondents who completed the entire survey, the final weight was created by dividing their first-stage screener weight by their predicted probability of completing the full survey. This weight was also trimmed at the 99th percentile.
Both the first and second stage models used the same predictor variables that were available for every individual in the sample. Specifically, the following variables were created for each sampled individual:
- Job title grouping
- Media outlet type grouping
- Freelance journalist (yes/no)
- Major metropolitan areas (New York, Washington, D.C., Los Angeles, Chicago, Boston, San Francisco, Atlanta, Other location)
Sampling errors and tests of statistical significance take into account the effect of weighting. The following table shows the unweighted sample sizes and the error attributable to sampling that would be expected at the 95% level of confidence for different groups in the survey.
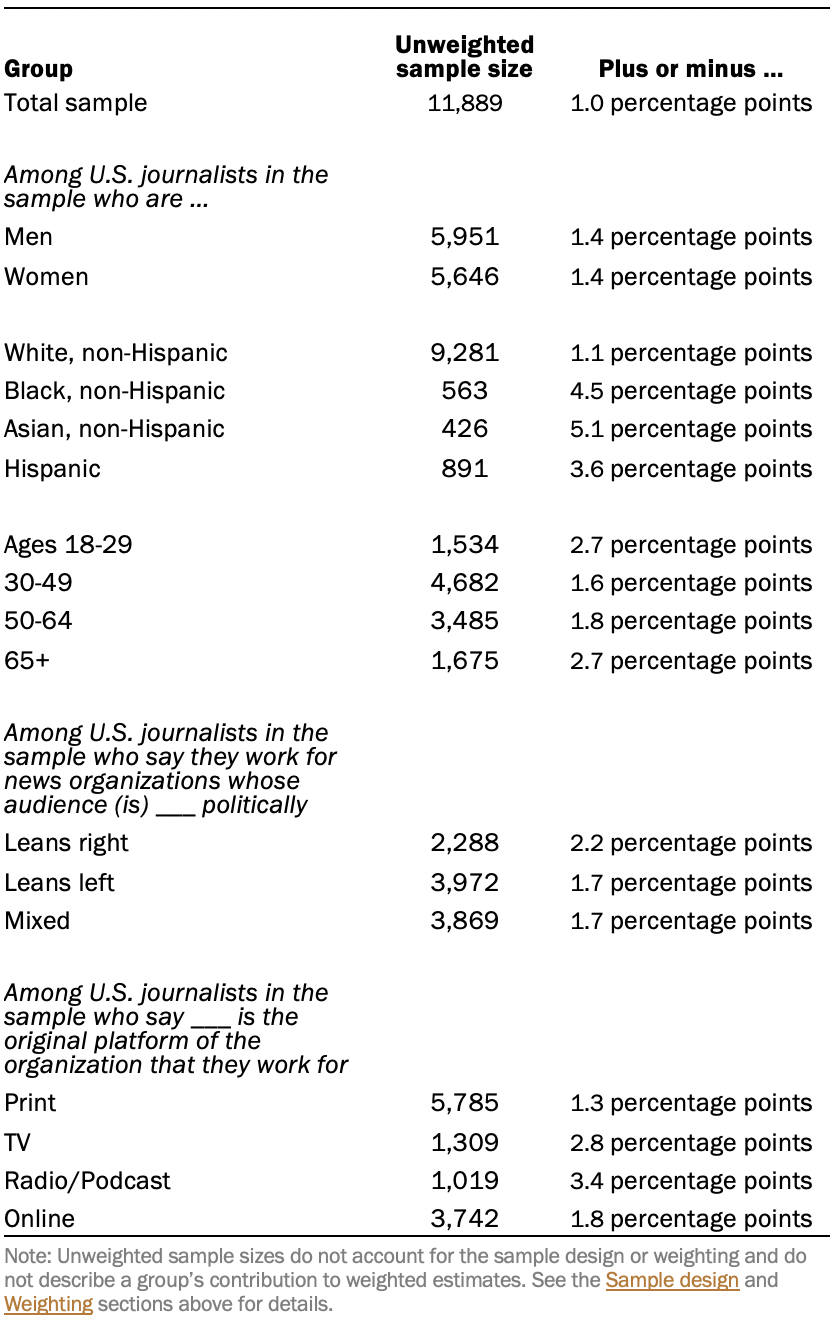
Sample sizes and sampling errors for other subgroups are available upon request. In addition to sampling error, one should bear in mind that question wording and practical difficulties in conducting surveys can introduce error or bias into the findings of opinion polls.
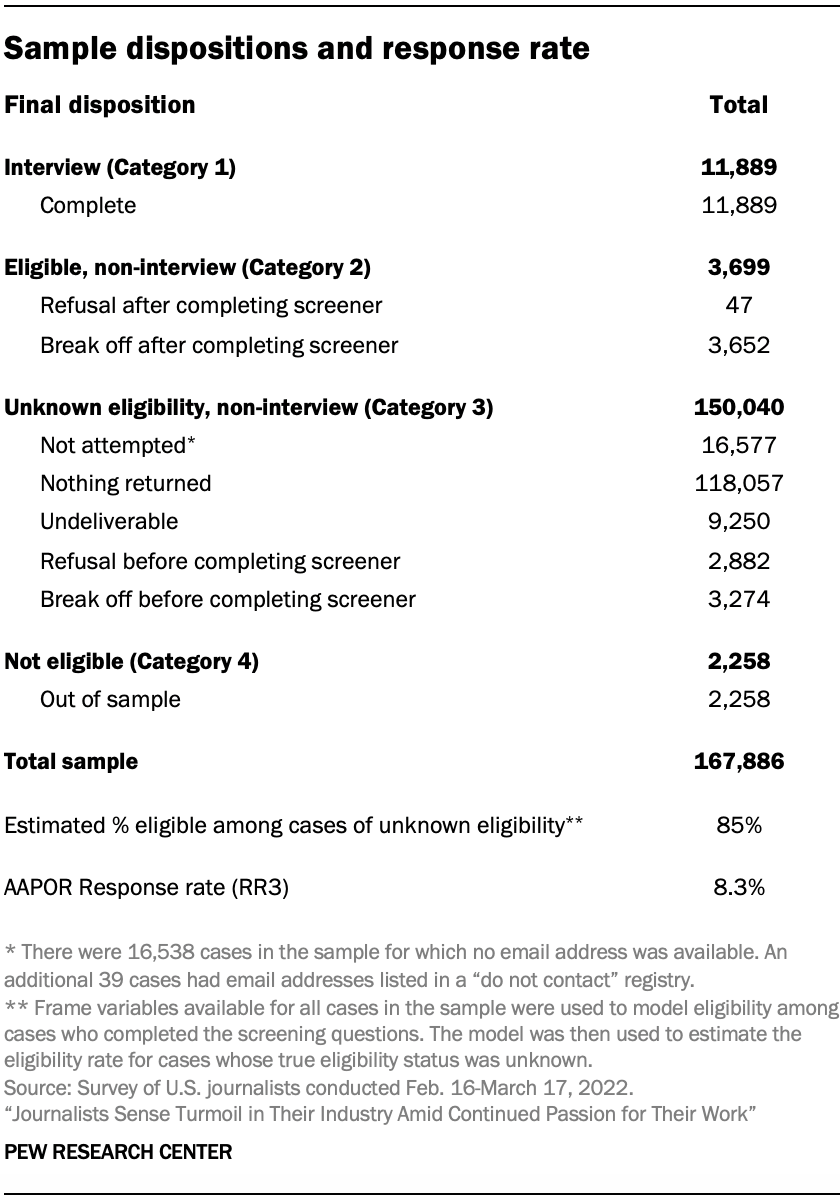
Advisory board
In addition to a team of subject area and methodological experts at the Pew Research Center, the project was also guided by an advisory board of five members. This board included both practitioners of journalism and scholars of journalism and related areas. Advisers provided feedback at various key points during the project, include on the sample design, the questionnaire, and a draft of the report.
Open-ended questions asked in the survey of journalists
One word to describe the news industry
In the questionnaire, journalists were asked in two open-ended questions to write in 1) the one word they would use to describe the news industry these days, and 2) the one word they think the public would use to describe the news industry these days. This allowed respondents to name any possible word that comes to mind. If respondents volunteered more than one concept, only the first one was accepted.
Researchers grouped these responses into categories of like words. For instance, a category for “struggling and chaos” was created that includes a number of other related words such as “dying,” “declining” and “under-resourced.” Additionally, each category was then determined to be a “negative,” “positive” or “neutral” word.
All categories that appeared among 2.0% or more of respondents are reported in the topline. All other categories that did not reach the 2.0% threshold were combined into one of the “other” categories based on the valance of the category.
One thing the news industry does the best and worst job at
Journalists were asked in a pair of open-ended questions to write down the one thing that the news industry does the best job of these days and what it does worst. This allowed respondents to provide any possible answer that came to mind. If more than one answer was provided in their response, only the first answer was accepted.
Researchers categorized each of the responses into one of nine broad categories, in addition to an “other” category for responses that did not belong in one of the nine categories and a response for those who did not know or did not provide a response. Responses to these two open-ended questions can be found in the topline.
February survey of U.S. adults: American Trends Panel survey methodology
Overview
The American Trends Panel (ATP), created by Pew Research Center, is a nationally representative panel of randomly selected U.S. adults. Panelists participate via self-administered web surveys. Panelists who do not have internet access at home are provided with a tablet and wireless internet connection. Interviews are conducted in both English and Spanish. The panel is being managed by Ipsos.
Data in this report is drawn from the panel wave conducted from Feb. 7 to Feb. 13, 2022. A total of 9,388 panelists responded out of 10,467 who were sampled, for a response rate of 90%. The cumulative response rate accounting for nonresponse to the recruitment surveys and attrition is 3%. The break-off rate among panelists who logged on to the survey and completed at least one item is 1%. The margin of sampling error for the full sample of 9,388 respondents is plus or minus 1.6 percentage points.
Panel recruitment

The ATP was created in 2014, with the first cohort of panelists invited to join the panel at the end of a large, national, landline and cellphone random-digit-dial survey that was conducted in both English and Spanish. Two additional recruitments were conducted using the same method in 2015 and 2017, respectively. Across these three surveys, a total of 19,718 adults were invited to join the ATP, of whom 9,942 (50%) agreed to participate.
In August 2018, the ATP switched from telephone to address-based recruitment. Invitations were sent to a stratified, random sample of households selected from the U.S. Postal Service’s Delivery Sequence File. Sampled households receive mailings asking a randomly selected adult to complete a survey online. A question at the end of the survey asks if the respondent is willing to join the ATP. Starting in 2020 another stage was added to the recruitment. Households that do not respond to the online survey are sent a paper version of the questionnaire, $5 and a postage-paid return envelope. A subset of the adults returning the paper version of the survey are invited to join the ATP. This subset of adults receive a follow-up mailing with a $10 pre-incentive and invitation to join the ATP.
Across the four address-based recruitments, a total of 19,822 adults were invited to join the ATP, of whom 17,472 agreed to join the panel and completed an initial profile survey. In each household, the adult with the next birthday was asked to go online to complete a survey, at the end of which they were invited to join the panel. Of the 27,414 individuals who have ever joined the ATP, 11,691 remained active panelists and continued to receive survey invitations at the time this survey was conducted.
The U.S. Postal Service’s Delivery Sequence File has been estimated to cover as much as 98% of the population, although some studies suggest that the coverage could be in the low 90% range.1 The American Trends Panel never uses breakout routers or chains that direct respondents to additional surveys.
Sample design
The overall target population for this survey was non-institutionalized persons ages 18 and older, living in the U.S., including Alaska and Hawaii.
Questionnaire development and testing
The questionnaire was developed by Pew Research Center in consultation with Ipsos. The web program was rigorously tested on both PC and mobile devices by the Ipsos project management team and Pew Research Center researchers. The Ipsos project management team also populated test data that was analyzed in SPSS to ensure the logic and randomizations were working as intended before launching the survey.
Incentives
All respondents were offered a post-paid incentive for their participation. Respondents could choose to receive the post-paid incentive in the form of a check or a gift code to Amazon.com or could choose to decline the incentive. Incentive amounts ranged from $5 to $15 depending on whether the respondent belongs to a part of the population that is harder or easier to reach. Differential incentive amounts were designed to increase panel survey participation among groups that traditionally have low survey response propensities.
Data collection protocol
The data collection field period for this survey was Feb. 7 to Feb. 13, 2022. Postcard notifications were mailed to all ATP panelists with a known residential address on Feb. 7.
Invitations were sent out in two separate launches: Soft Launch and Full Launch. Sixty panelists were included in the soft launch, which began with an initial invitation sent on Feb. 7, 2022. The ATP panelists chosen for the initial soft launch were known responders who had completed previous ATP surveys within one day of receiving their invitation. All remaining English- and Spanish-speaking panelists were included in the full launch and were sent an invitation on Feb. 8.
All panelists with an email address received an email invitation and up to two email reminders if they did not respond to the survey. All ATP panelists that consented to SMS messages received an SMS invitation and up to two SMS reminders.
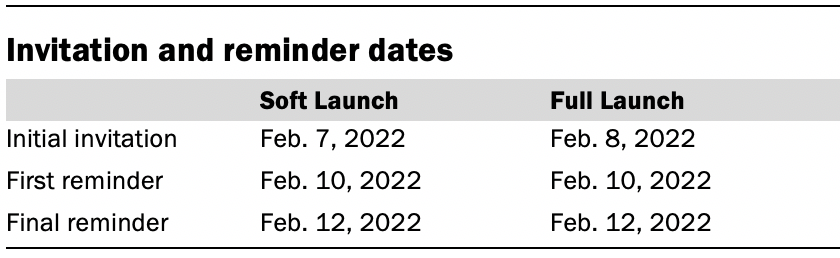
Data quality checks
To ensure high-quality data, the Center’s researchers performed data quality checks to identify any respondents showing clear patterns of satisficing. This includes checking for very high rates of leaving questions blank, as well as always selecting the first or last answer presented. As a result of this checking, three ATP respondents were removed from the survey dataset prior to weighting and analysis.
Weighting
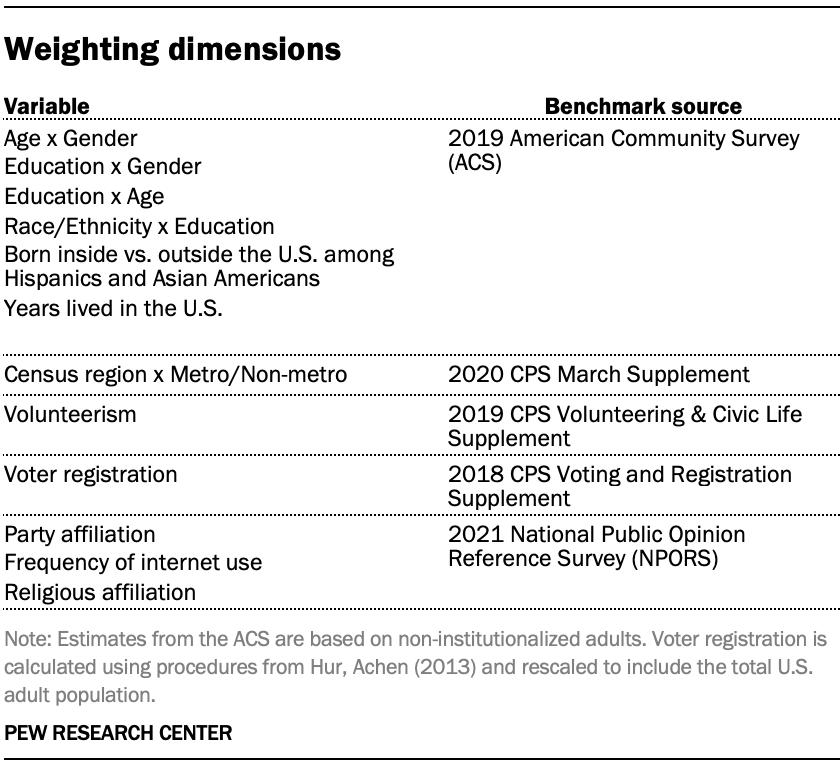
The ATP data is weighted in a multistep process that accounts for multiple stages of sampling and nonresponse that occur at different points in the survey process. First, each panelist begins with a base weight that reflects their probability of selection for their initial recruitment survey. The base weights for panelists recruited in different years are scaled to be proportionate to the effective sample size for all active panelists in their cohort and then calibrated to align with the population benchmarks in the accompanying table to correct for nonresponse to recruitment surveys and panel attrition. If only a subsample of panelists was invited to participate in the wave, this weight is adjusted to account for any differential probabilities of selection.
Among the panelists who completed the survey, this weight is then calibrated again to align with the population benchmarks identified in the accompanying table and trimmed at the 1st and 99th percentiles to reduce the loss in precision stemming from variance in the weights. Sampling errors and tests of statistical significance take into account the effect of weighting.
Some of the population benchmarks used for weighting come from surveys conducted prior to the coronavirus outbreak that began in February 2020. However, the weighting variables for panelists recruited in 2021 were measured at the time they were recruited to the panel. Likewise, the profile variables for existing panelists were updated from panel surveys conducted in July or August 2021.
This does not pose a problem for most of the variables used in the weighting, which are quite stable at both the population and individual levels. However, volunteerism may have changed over the intervening period in ways that made their 2021 measurements incompatible with the available (pre-pandemic) benchmarks. To address this, volunteerism is weighted using the profile variables that were measured in 2020. For all other weighting dimensions, the more recent panelist measurements from 2021 are used.
For panelists recruited in 2021, plausible values were imputed using the 2020 volunteerism values from existing panelists with similar characteristics. This ensures that any patterns of change that were observed in the existing panelists were also reflected in the new recruits when the weighting was performed.
The following table shows the unweighted sample sizes and the error attributable to sampling that would be expected at the 95% level of confidence for different groups in the survey.
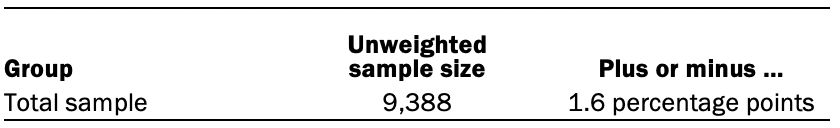
Sample sizes and sampling errors for other subgroups are available upon request. In addition to sampling error, one should bear in mind that question wording and practical difficulties in conducting surveys can introduce error or bias into the findings of opinion polls.
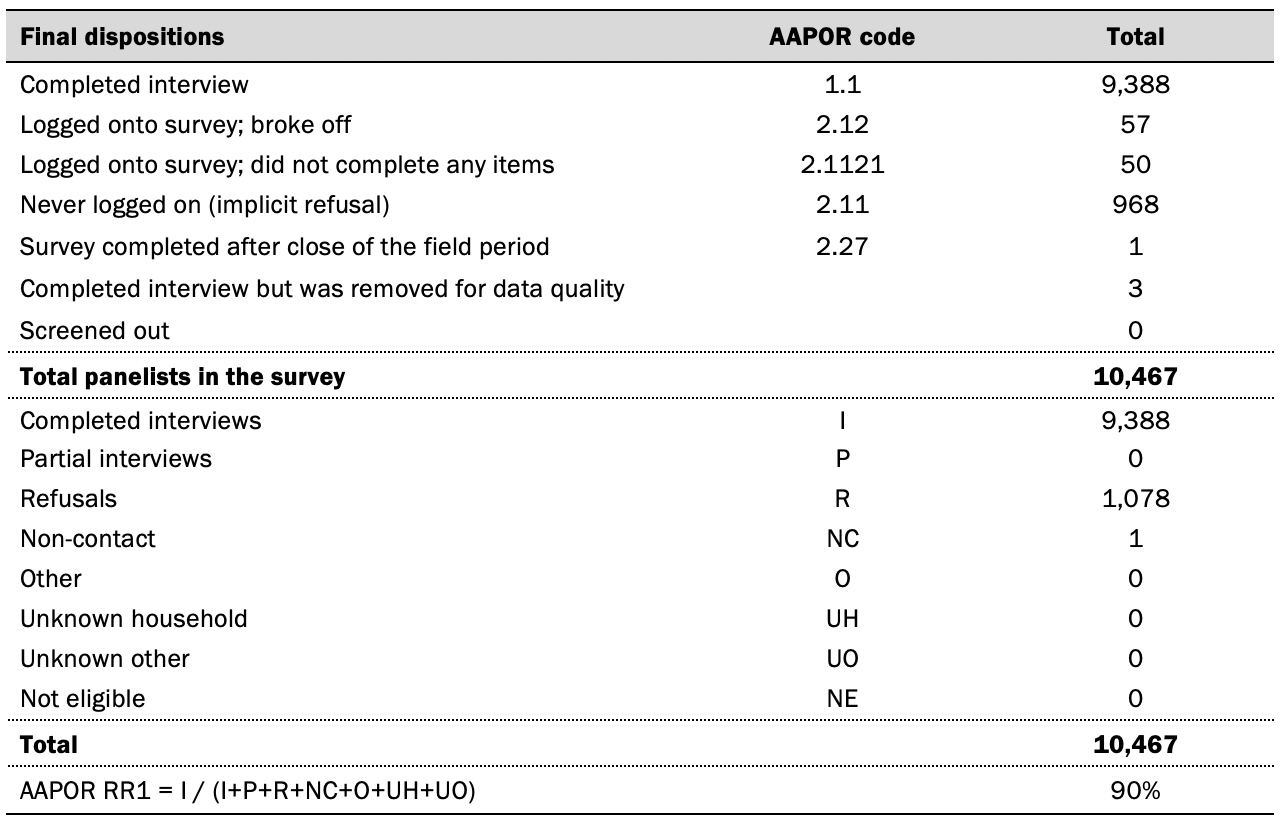
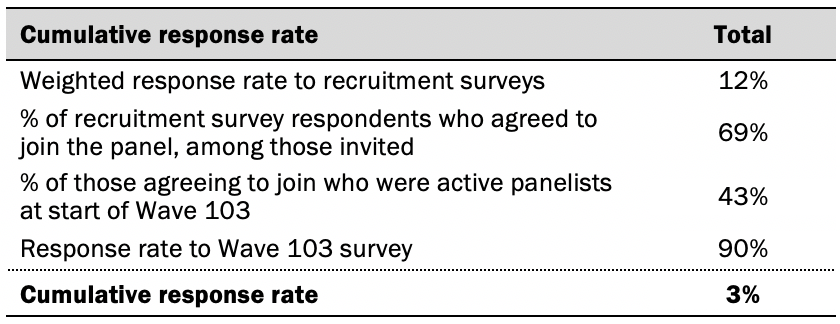
March survey of U.S. adults: American Trends Panel survey methodology
Overview
The American Trends Panel (ATP), created by Pew Research Center, is a nationally representative panel of randomly selected U.S. adults. Panelists participate via self-administered web surveys. Panelists who do not have internet access at home are provided with a tablet and wireless internet connection. Interviews are conducted in both English and Spanish. The panel is being managed by Ipsos.
Data in this report is drawn from the panel wave conducted from March 7 to March 13, 2022. A total of 10,441 panelists responded out of 11,687 who were sampled, for a response rate of 89%. The cumulative response rate accounting for nonresponse to the recruitment surveys and attrition is 3%. The break-off rate among panelists who logged on to the survey and completed at least one item is 1%. The margin of sampling error for the full sample of 10,441 respondents is plus or minus 1.5 percentage points.
Panel recruitment
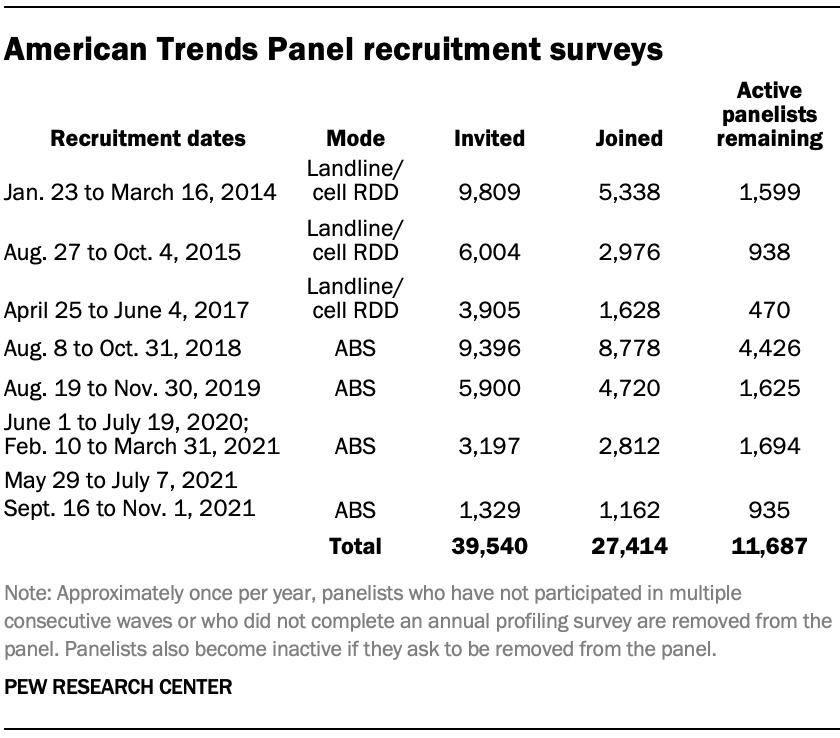
The ATP was created in 2014, with the first cohort of panelists invited to join the panel at the end of a large, national, landline and cellphone random-digit-dial survey that was conducted in both English and Spanish. Two additional recruitments were conducted using the same method in 2015 and 2017, respectively. Across these three surveys, a total of 19,718 adults were invited to join the ATP, of whom 9,942 (50%) agreed to participate.
In August 2018, the ATP switched from telephone to address-based recruitment. Invitations were sent to a stratified, random sample of households selected from the U.S. Postal Service’s Delivery Sequence File. Sampled households receive mailings asking a randomly selected adult to complete a survey
online. A question at the end of the survey asks if the respondent is willing to join the ATP. Starting in 2020 another stage was added to the recruitment. Households that do not respond to the online survey are sent a paper version of the questionnaire, $5 and a postage-paid return envelope. A subset of the adults returning the paper version of the survey are invited to join the ATP. This subset of adults receive a follow-up mailing with a $10 pre-incentive and invitation to join the ATP.
Across the four address-based recruitments, a total of 19,822 adults were invited to join the ATP, of whom 17,472 agreed to join the panel and completed an initial profile survey. In each household, the adult with the next birthday was asked to go online to complete a survey, at the end of which they were invited to join the panel. Of the 27,414 individuals who have ever joined the ATP, 11,687 remained active panelists and continued to receive survey invitations at the time this survey was conducted.
The U.S. Postal Service’s Delivery Sequence File has been estimated to cover as much as 98% of the population, although some studies suggest that the coverage could be in the low 90% range.2 The American Trends Panel never uses breakout routers or chains that direct respondents to additional surveys.
Sample design
The overall target population for this survey was non-institutionalized persons ages 18 and older, living in the U.S., including Alaska and Hawaii.
Questionnaire development and testing
The questionnaire was developed by Pew Research Center in consultation with Ipsos. The web program was rigorously tested on both PC and mobile devices by the Ipsos project management team and Pew Research Center researchers. The Ipsos project management team also populated test data that was analyzed in SPSS to ensure the logic and randomizations were working as intended before launching the survey.
Incentives
All respondents were offered a post-paid incentive for their participation. Respondents could choose to receive the post-paid incentive in the form of a check or a gift code to Amazon.com or could choose to decline the incentive. Incentive amounts ranged from $5 to $20 depending on whether the respondent belongs to a part of the population that is harder or easier to reach.
Differential incentive amounts were designed to increase panel survey participation among groups that traditionally have low survey response propensities.
Data collection protocol
The data collection field period for this survey was March 7 to March 13, 2022. Postcard notifications were mailed to all ATP panelists with a known residential address on March 7.
Invitations were sent out in two separate launches: Soft Launch and Full Launch. Sixty panelists were included in the soft launch, which began with an initial invitation sent on March 7. The ATP panelists chosen for the initial soft launch were known responders who had completed previous ATP surveys within one day of receiving their invitation. All remaining English- and Spanish-speaking panelists were included in the full launch and were sent an invitation on March 8.
All panelists with an email address received an email invitation and up to two email reminders if they did not respond to the survey. All ATP panelists that consented to SMS messages received an SMS invitation and up to two SMS reminders.
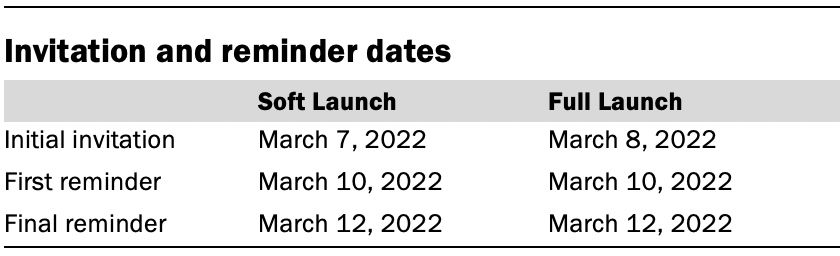
Data quality checks
To ensure high-quality data, the Center’s researchers performed data quality checks to identify any respondents showing clear patterns of satisficing. This includes checking for very high rates of leaving questions blank, as well as always selecting the first or last answer presented. As a result of this checking, three ATP respondents were removed from the survey dataset prior to weighting and analysis.
Weighting
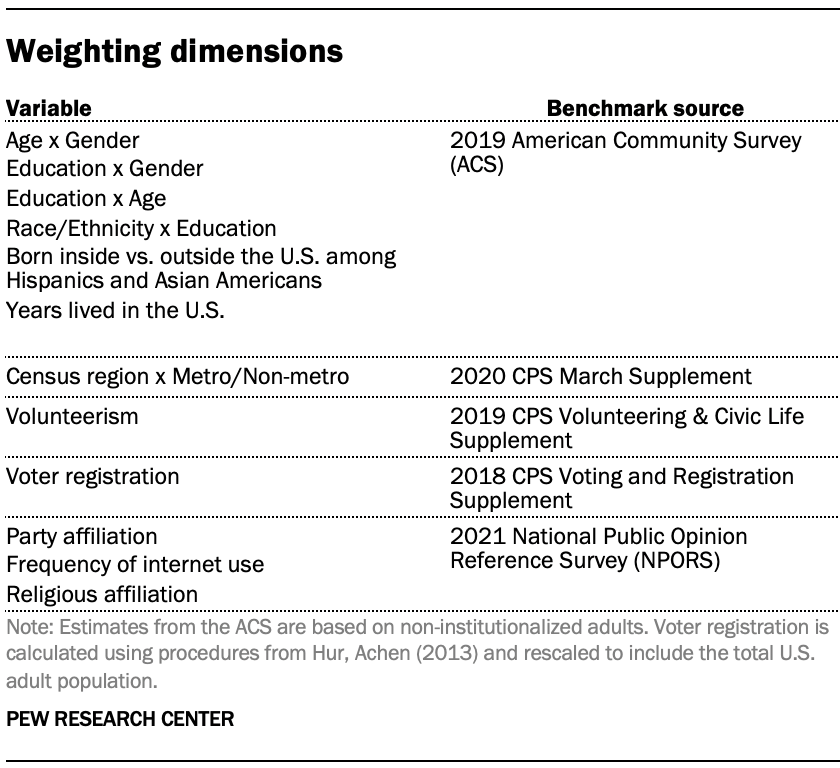
The ATP data is weighted in a multistep process that accounts for multiple stages of sampling and nonresponse that occur at different points in the survey process. First, each panelist begins with a base weight that reflects their probability of selection for their initial recruitment survey. The base weights for panelists recruited in different years are scaled to be proportionate to the effective sample size for all active panelists in their cohort and then calibrated to align with the population benchmarks in the accompanying table to correct for nonresponse to recruitment surveys and panel attrition. If only a subsample of panelists was invited to participate in the wave, this weight is adjusted to account for any differential probabilities of selection.
Among the panelists who completed the survey, this weight is then calibrated again to align with the population benchmarks identified in the accompanying table and trimmed at the 1st and 99th percentiles to reduce the loss in precision stemming from variance in the weights. Sampling errors and tests of statistical significance take into account the effect of weighting.
Some of the population benchmarks used for weighting come from surveys conducted prior to the coronavirus outbreak that began in February 2020. However, the weighting variables for panelists recruited in 2021 were measured at the time they were recruited to the panel. Likewise, the profile variables for existing panelists were updated from panel surveys conducted in July or August 2021.
This does not pose a problem for most of the variables used in the weighting, which are quite stable at both the population and individual levels. However, volunteerism may have changed over the intervening period in ways that made their 2021 measurements incompatible with the available (pre-pandemic) benchmarks. To address this, volunteerism is weighted using the profile variables that were measured in 2020. For all other weighting dimensions, the more recent panelist measurements from 2021 are used.
For panelists recruited in 2021, plausible values were imputed using the 2020 volunteerism values from existing panelists with similar characteristics. This ensures that any patterns of change that were observed in the existing panelists were also reflected in the new recruits when the weighting was performed.
The following table shows the unweighted sample sizes and the error attributable to sampling that would be expected at the 95% level of confidence for different groups in the survey.

Sample sizes and sampling errors for other subgroups are available upon request. In addition to sampling error, one should bear in mind that question wording and practical difficulties in conducting surveys can introduce error or bias into the findings of opinion polls.
Dispositions and response rates
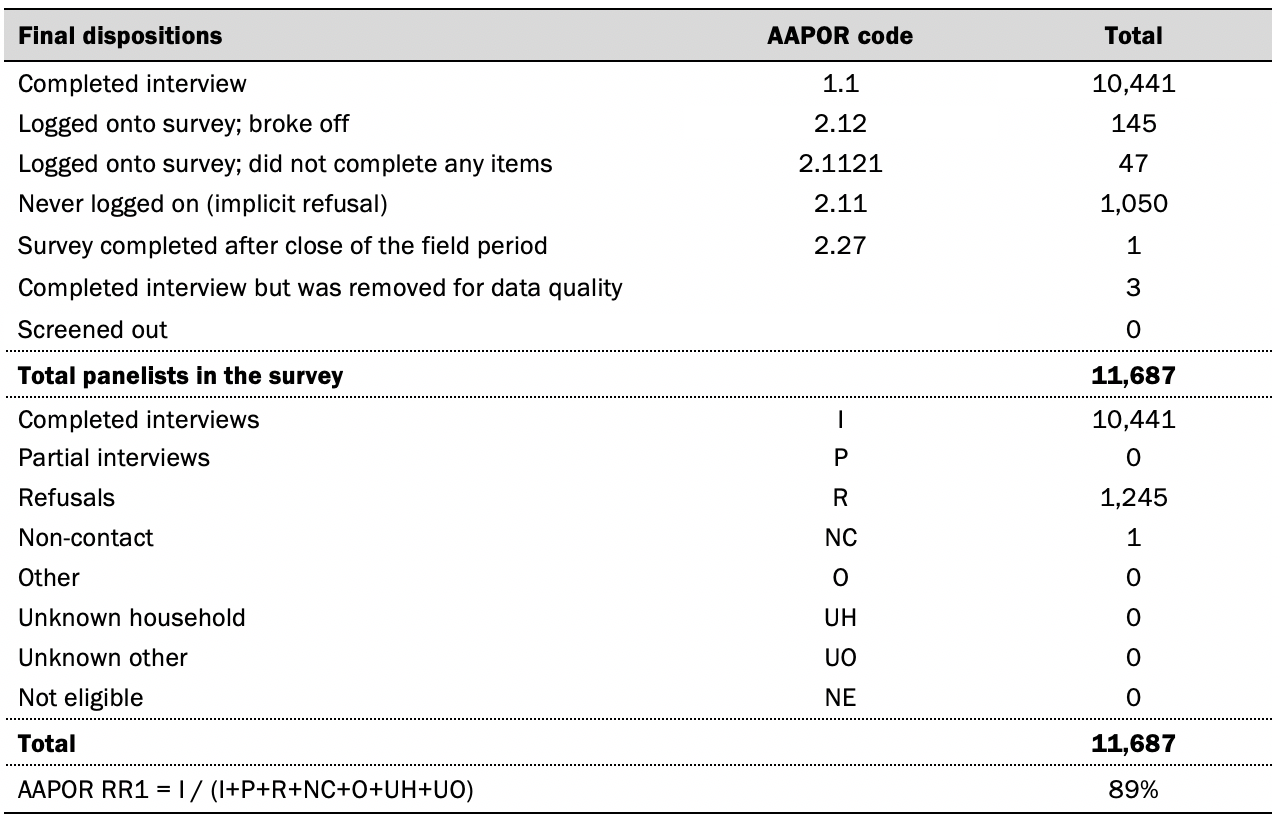
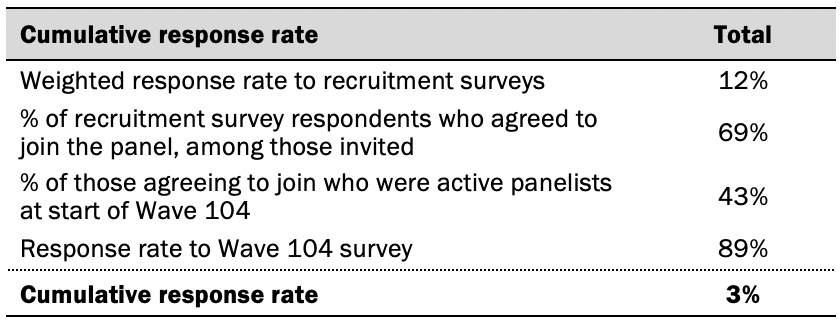


